We are pleased to announce the launch of GeoAnalitica’s 2020-vintage Mexico Demographic Data suite, the latest in our series of annually updated Mexico demographics, and the first to use INEGI’s Censo 2020 base-year data and boundaries. One hallmark of our demographics is their ability to reflect household and population growth, at the smallest area of detection, with a lag time of 12 months or less. Even though our 2020 demographic estimates reference the same calendar year as the Censo, we continue to find new growth to the tune of nearly a quarter million households, underscoring the rapid change of pace and highlighting the capabilities of our change-aware platform. But before diving into that, let's review a bit about the exciting results coming out of INEGI's Censo de Población y Vivienda 2020, a very robust data collection program that serves as the launchpad for our own annually-updated, growth-detecting Mexico demographic data.
While the core growth-detection methodology underpinning the 2020-vintage Mexico data is fundamentally unchanged, there are several exciting new changes that we’re rolling out in the 2020-vintage, to grow and evolve with Censo 2020 and other INEGI programs. But first, it makes sense to describe the relationship between Censo 2020 and our demographic data suite.
GeoAnalitica data, like most demographics packages, starts with “base-year” data. These are data that come from a reliable source, like a government statistics office, that are collected natively at the finest granularity. For programs like censuses, these data are collected by individual interviews, typically with the head of household. The scale, scope, and sampling rate of data collection from the government agencies in charge simply can’t be matched by a private industry. To give you some perspective, INEGI employed nearly 150,000 interviewers to conduct Censo 2020 over just a couple of months in early 2020.

While the granularity and sample size are amazing, business users of census-type data have one major unmet need: updating. Mexico’s Censo programs are conducted on a ten-year interval, with no reliable updates in the meantime. This is a huge issue for any business trying to assess their markets (and potential new sites) the way they are on the ground today, including any growth or change that has evolved locally since the latest Censo count. Censo 2020, like most census programs, is designed for political and social purposes, with suitability for business analysis being kind of a fringe benefit rather than an objective.

In most other developed countries, private demographics organizations step in to fill the gaps left since the latest census count. Using a number of methodologies, each with pros and cons, these firms market their ability to provide annual updates and estimates of demographics, generally using their local census boundaries and the most recent census demographic questionnaires/results as their base-year data. In the U.S., we count at least five firms doing this work on U.S. Census demographics scales.
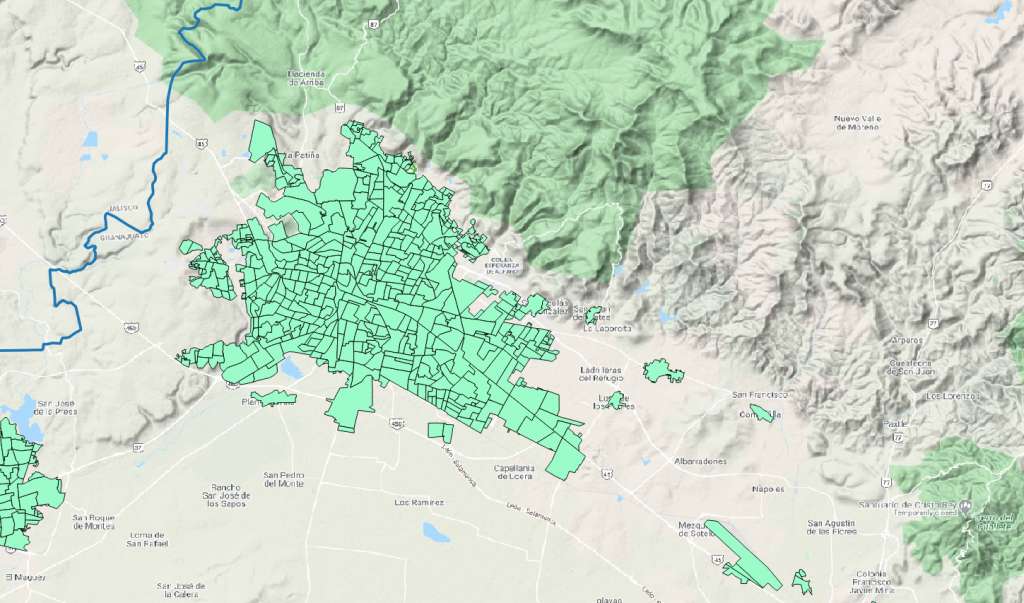
In Mexico, however, the market is much less developed. Apart from our estimates, it seems like most products are built using SWAG-style, rough estimations at low-granularity levels (perhaps Municipio). We’re fortunate to have built an allocation methodology that digests some very low-lag, high-sensitivity primary data that informs the size, scope and quality of population growth at some of the smallest Censo geostatistical units. We continue to make growth-aware estimates of Mexico demographics at AGEB for 2020 (Rural AGEB and Urban AGEB), and this year we are producing growth-detecting Mexico demographics at Localidad Rural (Rural Locality). We also re-aggregate these smaller geographies to Mexico Municipio demographic data estimates, and are capable of re-aggregating to most other standard (or custom) boundary types based on client needs.

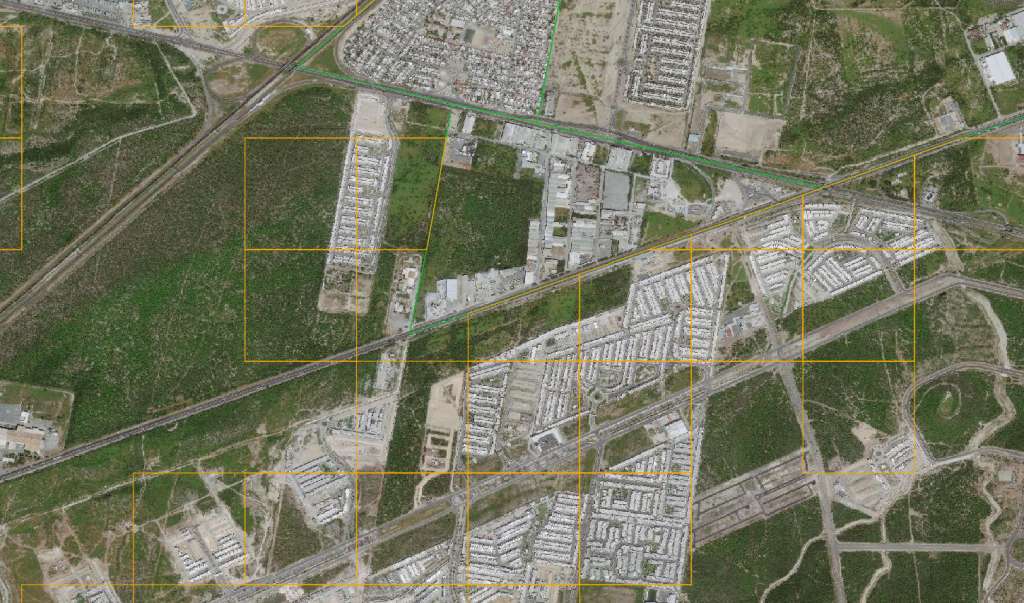
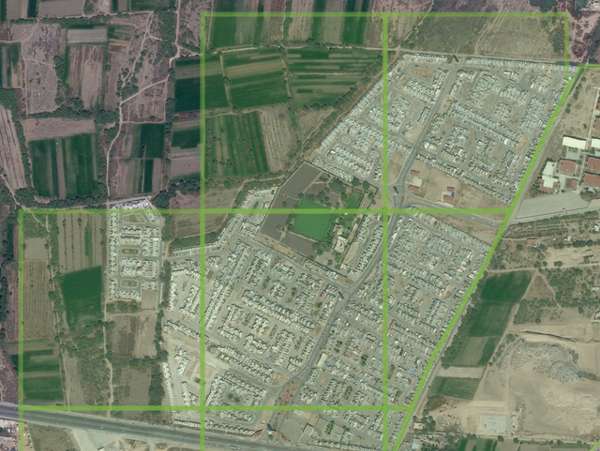
There’s one additional boundary found only in GeoAnalitica’s Mexico demographic data: our proprietary Growth Grid, which we delineate around new pockets of growth on the periphery of urbanized areas. Once we identify the new development or growth node, we slice its area out of a bounding Rural AGEB, and synthesize our estimates using intel we source on the size and socioeconomic levels of the new cluster of population. Even though the 2020-vintage demographic estimates come just months after the 100% Censo 2020 ground count, we were able to identify about 80,000 new households to include in our 2020 Growth Grids, and a further 150,000 new households associated to an existing INEGI boundary.

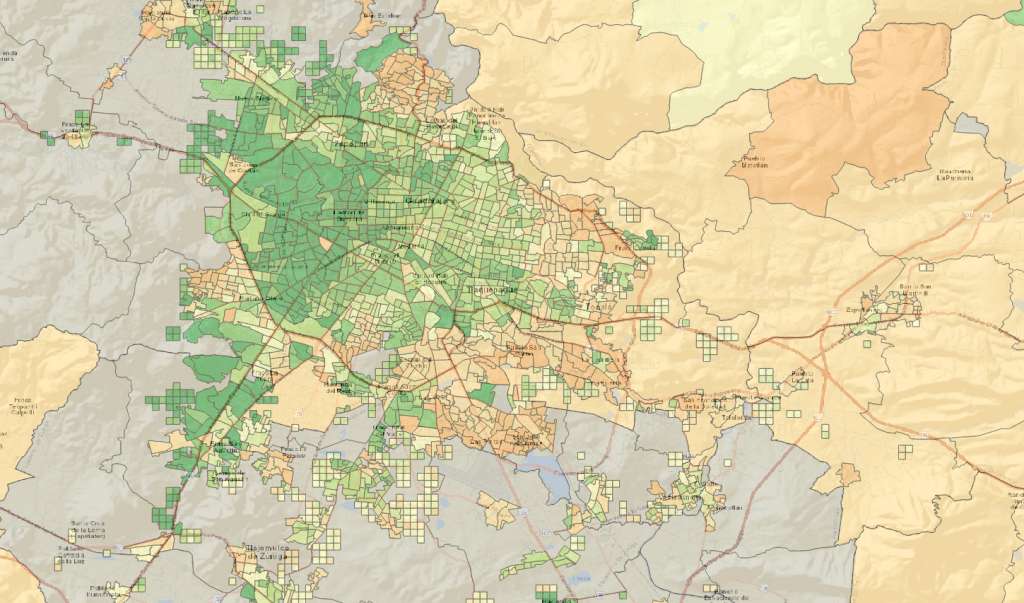
Censo-type demographic data is one must-have for the business analyst, but there are other necessary data that aren’t part of the Censo questionnaire. We think particularly about income, expenditures and socioeconomic classifications. While these data points are asked about in several other INEGI small-sample programs, there’s simply no source data that samples 100% of households. Be forewarned, any small-area income or socioeconomic data you see for Mexico are imputed; how they are imputed makes a huge difference. We think we have a pretty sharp methodology for making the walkacross, and we make use of several data sources and proprietary allocation techniques that give GeoAnalitica’s Mexico income data a fidelity to ground-truth that’s just not seen on most Mexico income guesstimates. We also produce Mexico socioeconomic classes (AB, C, D, etc.) for cross-compatibility with some of the external data sources most used by our client organizations.
While this blog post announces our new 2020-vintage Mexico data for demographics, income, and socioeconomic classes, there’s plenty more to come. We will be posting special highlights from our 2020 Mexico datasets here over the coming months, showing special growth stories, spotlights on specific aspects of our methodology, and plenty of interesting maps to go along with them. We encourage you to check back often, but in the meantime, we’re here to help your business with Mexico data for site selection, business analytics, and so much more.
It's been a few years since we took some time on this blog to talk about Mexico's Censo program (run by an organization named Instituto Nacional de Estadística, Geografía e Informática, best known by its acronym INEGI). Specifically, we want to do a deep-dive into the methodology and key vocabulary when it comes to INEGI's geostatistical boundaries, and particularly the urban boundaries of Mexico. While it's possible to look at Censo 2010 (and soon Censo 2020) results in a tabular way, the best insights seem to come when marrying together that tabular data with the boundaries that correspond to them on the map. That's hard to do without a firm grasp of how those boundaries were built, why they were built, and what's the 'fine print' a user should be aware of before putting these census data on the map. (Of course, there's tons to know and not all the info about Mexican census data can fit into one blog post, so contact us for an even deeper dive.)
Mexico's census program makes use of a nesting hierarchy of geographical boundaries. Technically, let's call them geostatistical units. At the very top of the hierarchy is (duh) the Nation, and the Nation is made up of States. Actually, in Mexico, the Nation is not simply made up of states -- it is made up of what you would call Federative Entities (Entidades Federativas). That's because Ciudad de México is technically not a State, but for census purposes, 'looks and acts' as if it were a State. In many ways, CDMX fills a similar function as the U.S. District of Columbia. In Mexico, there are 32 federative entities (31 States plus the Distrito Federal, a.k.a. Mexico City). One key thing to remember: the Entidad Federal is as much a geopolitical unit as it is a geostatistical unit. Meaning, there are uses way beyond the Mexican census for State boundaries, and if you ask anyone where they live, they're guaranteed to know their Entidad Federal.
Similarly filling those two distinct roles is the Municipio (roughly, Municipality in English, though they look and act kind of like a hybrid of a city and county government). They are political units, where campaigns are run to assume the Presidencia Municipal, an elected post similar to a mayor). Each Mexico Municipio has a seat of government, which is often (not always) the largest settlement in the Municipio. Note that in many cases, the seat of government is located in what was formerly the largest settlement in the Municipio, which in some cases nowadays are teeny tiny hamlets. The giveaway that you're in the, let's say, capital city of a Municipio is that you'll see a Palacio del Gobierno, which houses the municipalities government offices, and most of the time is located on a major town square along with the biggest or oldest Catholic church in town.
But enough about the political nature of a Mexican Municipio. Municipios, of which there are nearly 2,500, are also one of the most important Census boundaries for Mexico. They serve an important role in allocating public resources, which is a basic function of the Censo. They're also quite handy for business analysts performing demographic research, not only because of the Censo 2010 data (and soon Censo 2020 data), but also because they are a common boundary with other data sources independent of INEGI Censo programs. For example, want to get an idea of how many private vehicles are registered in a Mexican municipio? Easily found via a compilation of data provided by Municipio governments to a central government database. Roll-ups of crime data? Also provided at a Municipio level by the local governments. The Municipio is important for demographic data analysis in Mexico because it allows the analyst to mash up population data from the Mexican Census with other datasets that are more recent or more narrow in focus. Oh yeah, the other thing worth knowing is that this is the smallest geographic boundary in Mexico that covers 100% of the territory, with no distinction between what's a rural area and what's an urban area.
A sub-division of Municipios is the Localidad Urbana, or urban locality. This is one of our least-favorite geostatistical units, simply for the reason that they don't provide much more than a Municipio does. There are fewer than 5,000 of these, meaning an average of less than two per Municipio. Unlike Municipio boundaries, where ancillary data can easily be matched up and mashed up with Censo 2010 or Censo 2020 data, Localidades Urbanas seem to be rarely used by other primary data collection organizations in Mexico. Sure, there's a time and a place to look at Localidad data, but most demographic analysis is better served by skipping these entirely and moving on to the Urban AGEB, instead.
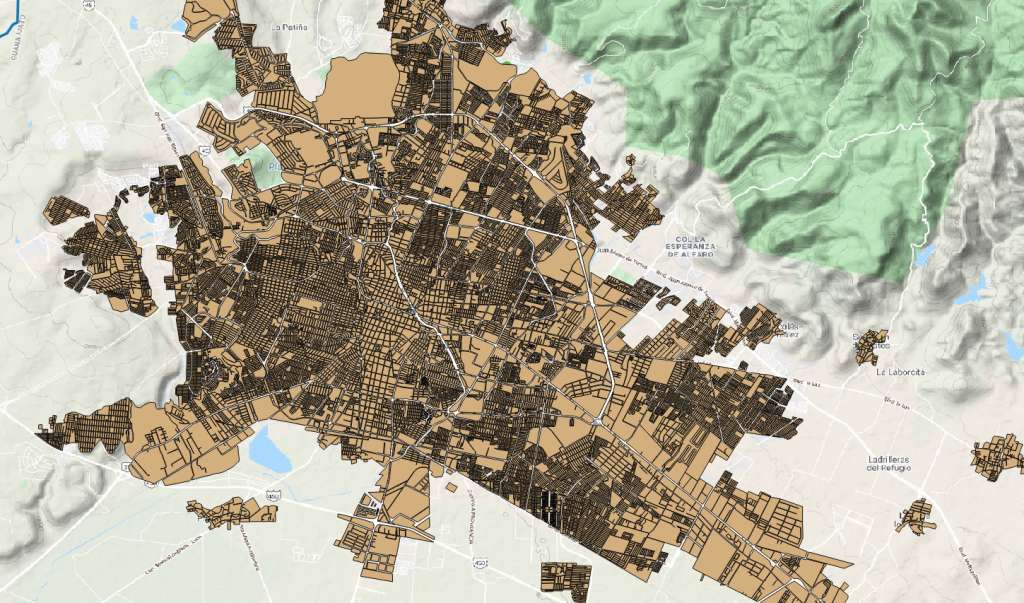
High-def demographic analytics starts with Mexico's AGEBes Urbanas (Urban AGEBs), which are purely geostatistical units (in fact, AGEB itself is an acronym for Área GeoEstadística Básica). Ask anyone their state and municipio, and they'll know it. They probably know their Localidad too. But only the nerdiest of all, or INEGI workers themselves, know or care what AGEB Urbana their home is in. AGEBes Urbanas are somewhat arbitrarily drawn about a year before the Censo by a team of INEGI cartographers, usually with reference to natural geographical and infrastructural breaks (rivers, roads, etc.). They are used for data analysis in many government, academic, and private-sector demographic research programs, and they are sometimes appended to points-of-interest (like Mexico Business Locations) to facilitate match-ups between Mexican Census and Mexican POI data.
Nonetheless, Mexican Censo 2010 and Censo 2020 Urban AGEBs are mainly used for demographic analysis, such as trade area analytics, market planning, etc. In some cases they can be used in conjunction with customer intercept data (home address, colonias, Códigos Postales) to infer a likely socioeconomic class, income level, family size, or other demographic characteristic. There are literally a couple hundred INEGI Censo variables associated with each AGEB. (These AGEB-level data form the base year for GeoAnalitica's most popular products, and these are the data that we growth-adjust to come up with current-year Mexico demographic data and estimates each year.) There were over 56,000 AGEBes Urbanas in Censo 2010, and there will be even more come Censo 2020.
A final comment on the Urban AGEBs: they're called Urban for a reason. Outside of urban and suburban areas, they cease to exist (that's where AGEBes Rurales reign supreme, but that's a topic for another post entirely). But just because there's no Urban AGEB doesn't necessarily mean there's no urban-type housing. Basically, as most cities expand, they tend to grow outward and not upward. (Mexico City is a notable exception, as it's geographically constrained...and upward really is more cost-effective than outward.) So, even within months of Mexico's census results being published, the boundaries are already out of date. (We built our own 'synthetic' Urban AGEBs, called Growth Grids, to tackle exactly that problem. More on those separately.)
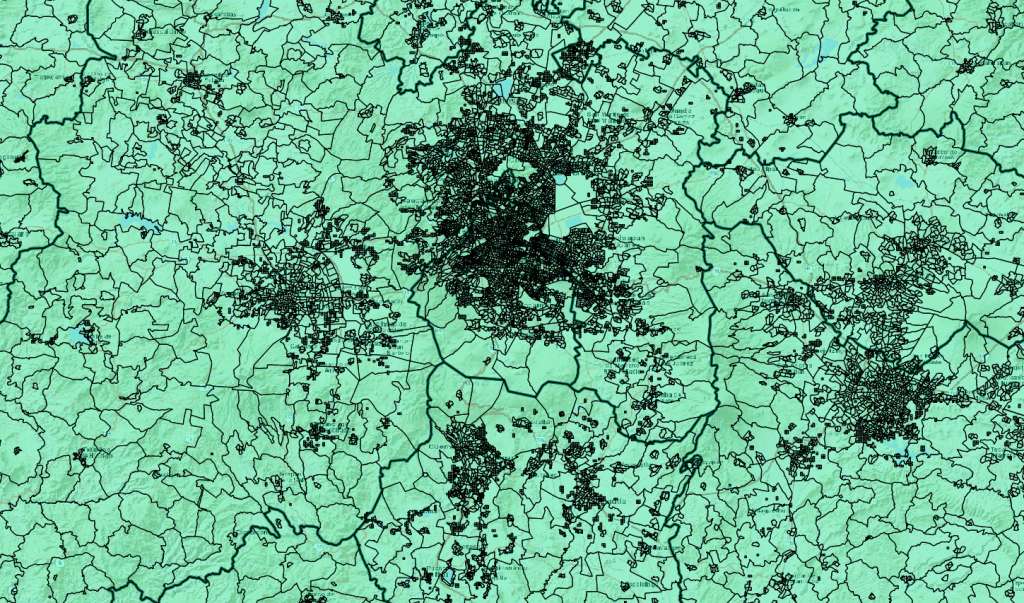
Digging even deeper than an Urban AGEB is possible, but not an avenue we suggest for most users. The Manzana is the smallest polygon-type boundary in the Mexican census, and is analagous to a U.S. Census Block. So why don't we recommend the Manzana? One reason is cartographic. INEGI delineates Urban Manzanas in a non-contiguous manner, meaning their border often don't line up, leaving blank space between them on the map that makes thematic mapping clunky and unappealing. But the bigger, and less superficial, reason to avoid the Manzana stems from a privacy issue. Censo 2010 and Censo 2020 have certain privacy protection mechanisms built in to their publicly disseminated data. If the count of people or households in a certain Manzana doesn't pass a threshold value, then much of the detailed data is zeroed out, theoretically to avoid the possibility of bad actors from knowing or inferring detailed data about a person based on their residence. A surprisingly large number of Manzanas have had much of their detailed demographic data wiped out for just that reason, rendering them useless for market planning research.
There are some other boundaries worth talking about, but we'll save them for some future posts. Check back in for future commentary on other censal geographies like Rural AGEBs and Rural Localidades, as well as non-censal geographies like Mexico colonia boundaries and Mexican Códigos Postales. We may even dive into a few point-type data resources, like Mexico business location data or even urban address geocoding. We love helping businesses dive into demographic data for their Mexico operations, so reach out if you have a question or a need. Thanks for joining us on this look at Mexico census data boundaries!
We’re pleased to announce the release of our newest vintage of Mexico geodemographic data. GeoAnalitica’s 2019 Mexico data products offer growth-adjusted estimates for a few hundred variables (among them, 2019 population, 2019 household count, and 2019 household income). Our 2019 Mexico estimates are available at the most relevant geographic units: a package of Urban AGEBs, Rural AGEBs, and Growth Grids that offer 100% territorial coverage in high-definition.
We’re particularly excited because this vintage of data is possibly the final vintage based on Censo 2010 AGEBs and base-year data. Mexico Censo 2010 has never been more outdated than it is right now, and we cringe to even imagine companies using straight-out-of-Censo 2010 results to make decisions right now in 2020. Meanwhile, Mexico’s Censo 2020 is currently in progress, and there’s a possibility its tabulations and cartography will be published in time to guide GeoAnalitica’s next vintage of 2020 Mexico population and demographic estimates. (Though, keep in mind, by the time Censo 2020 is published – even in the absence of any COVID-related slowdowns – it’s already 8-12 months out of date, due to the enormous need for lead-time when delineating geographies and conducting in-person follow-up interviews).
It’s always more fun to put our new vintages in perspective with numbers. Our 2019 dataset covers 90,989 geographic units (split among Urban AGEBs, Rural AGEBs, and our proprietary Growth Grids, which identify pockets of urban-type population outside of traditional Urban AGEBs). In those nearly 91,000 geographic units, we estimate Mexico’s population in 2019 at 127,147,385 people. We are also estimating Mexico household count in 2019 of 32,560,630. And, to top it all off, we estimate a 2019 Mexico average household income of MXN$221,000. We also classify AGEBs and Growth Grids according to their most likely predominant social class, so we’re able to estimate households falling in class A/B, C+, C, C-, D+, D and E (get in touch with us through our contact form if you’re curious about those numbers.) There are a few hundred other variables that we estimate, but these are the ones we’re most frequently asked about.
Remember, these are national figures, and we’ll go out on a limb and tell you the uncomfortable truth: unless you’re in a business with absolutely zero geographic footprint, it kind of doesn’t matter what the national numbers look like. It’s much better to have a reliable, ground-level estimates so you can understand market-level realities and changes over time. Things like, which part of the Guadalajara metro area has the highest concentration of high socioeconomic class? Which cities in the Bajío are experiencing the strongest population growth, and what corner of the city is it the strongest? Whether you’re in the business of site selection for retail outlets in Mexico, logistics planning, or anything else that has a geographic footprint at its core, you should see what our data has to say. Reach out to us if you’d like to dig in deeper to GeoAnalitica’s Mexico 2019 demographics.
Cada año, GeoAnalitica hace un recorrido de un área de Mexico, para sacar fotos de las comunidades representadas por nuestras Cuadras de Crecimiento. Lo hacemos para poder mostrar en nuestra mercadotecnia cómo se ven las Cuadras en la vida cotidiana. También intentamos reforzar el idea: sin los datos demográficos de las Cuadras (que no se cubren por el Censo), las empresas mexicanas no sabrían ni el dónde ni el cuánto de los consumidores que viven en áreas recién construidas.
El verano pasado, fuimos al Bajío, un área que ha experimentado mucho crecimiento residencial, un resultado del fuerte crecimiento industrial que ha aumentado y mejorado la economía de la región. En este blog, vamos a enfocarnos en el sureste de la ciudad de Querétaro. Residencial del Parque es una comunidad compuesta de varias etapas de desarrollo, que se construyeron uno tras uno desde 2012. No hay que decir que esta área no fue censada, ni tampoco fue incorporada dentro de ningún AGEB, porque el Censo fue solo un snapshot del año 2010.
Aunque no aparezca en ninguna otra fuente de datos demográficos, Residencial del Parque sí existe, sí crece, y sí es un núcleo de consumidores de clase media. GeoAnalitica estima que en los 4 Cuadras de Crecimiento que forman esta comunidad, existen unas 4509 personas dentro de 1346 hogares. Ellos pueden hacer la diferencia entre la decisión de ubicarse en el área y no.
Nuestra metodología estima más que el número de personas y de hogares. Hay cientos de variables, y entre ellos, lo más pedido es el Nivel Socioeconómico. Construimos este variable tomando en cuenta estimativas de la vecindad proporcionadas por el gobierno, también con índices de los valores de viviendas con respecto a promedios regionales. En Residencial del Parque, estimábamos un NSE de C y de D+, que a pesar de todo que vimos, parece un poco bajo. Las casas, la vigilancia, los carros del año, todo representa una clase de C y más alta. (Ésta es otra propuesta de nuestros recorridos: identificar áreas geográficas en cuales nuestra metodología tiene fracasos, para poder afinarla en el año que viene.)
Después de nuestros recorridos, publicamos las fotos en Mapillary, una plataforma abierta que nos permite compartir los Streetviews (y, también, nuestras fotos les ayudan a la comunidad OSM mejorar sus mapas en estas áreas tan nuevas). Así, puedes ver lo que vimos en Residencial del Parque, como si estuvieras allí en vivo. Pasa un par de minutos observando las fotos, y pregúntate: ¿cómo se mejoraría nuestro proceso de selección inmobiliaria si tomara en cuenta el crecimiento que se nota en esta Cuadra de GeoAnalitica?
San Luis Potosí is riding the same wave as so many of its neighbors. Good quality of life, a stable security situation, and a central location coupled with great infrastructure make for a booming local economy. The expansion of middle-class jobs in SLP has created a significant demand for new housing, and true to form, developers are building to meet those needs with high-density single-family homes.
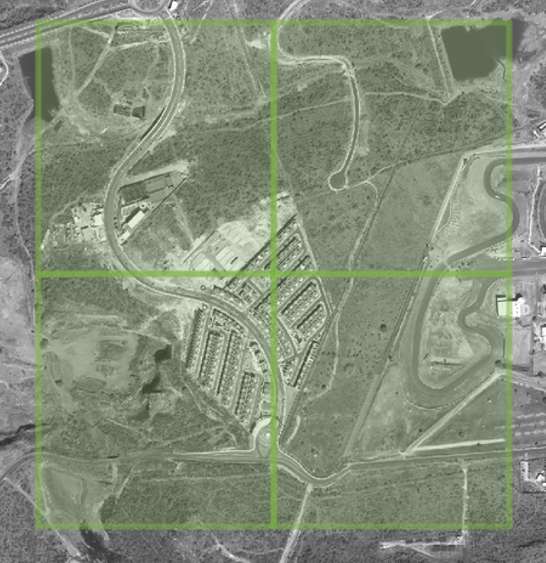
Today, we’ll take a look at Residencial Puerta Real, on the northern edge of SLP. It is quite literally “on the other side of the periférico”, situated along the urban ring-road in a way that allows its residents easy commuting to industrial outgrowth to the south and business centers downtown. Puerta Real has been growing piecemeal, with initial phases starting just after Censo 2010, and new phases that -- even to this day – are being completed and sold to SLP’s burgeoning middle class. (You can take a look at GeoAnalitica’s embedded Mapillary streetviews below, which we shot during our 2019 research trip to the Bajío region.)
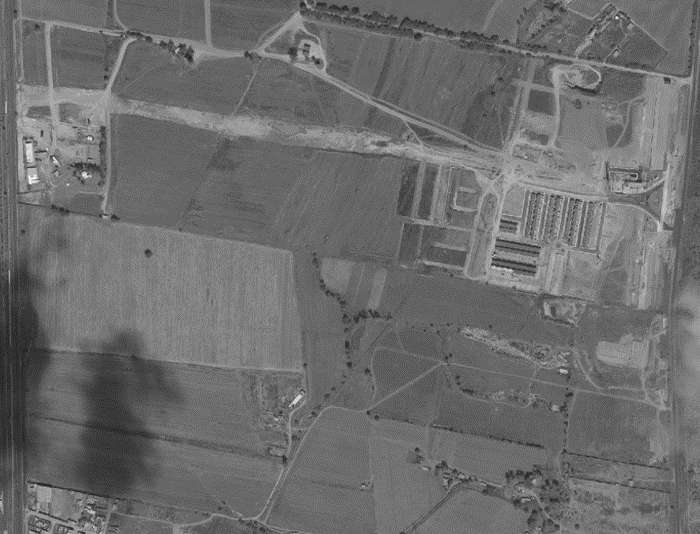
Like so many other recent growth stories, you won’t find Residencial Puerta Real in any INEGI dataset. How could it be, when it didn’t exist the last time data were collected? Censo 2010 geography teams delineate boundaries (Manzanas, AGEBes and others) about a year before a given census, which means that if a development was not constructed by 2009, it was pretty unlikely to have an AGEB delineated around it. And, where there’s no AGEB boundary, there simply can’t be any Censo 2010 data to fill it up.
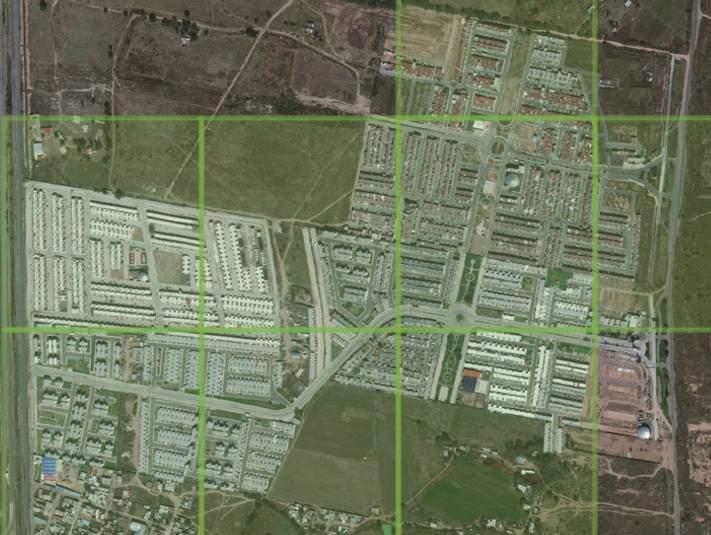
That’s why we developed our own boundaries called Growth Grids, and methodologies to “fill them up” with demographic estimates. (Readers who have been keeping up with GeoAnalitica can probably recite that whole line of logic by heart.) This gives the analysts who need it the most – i.e., corporate site selection specialists – the data they need to rationalize a trade area and to evaluate its economics. And it doesn’t take many Growth Grids to make a material impact on a trade area’s numbers.

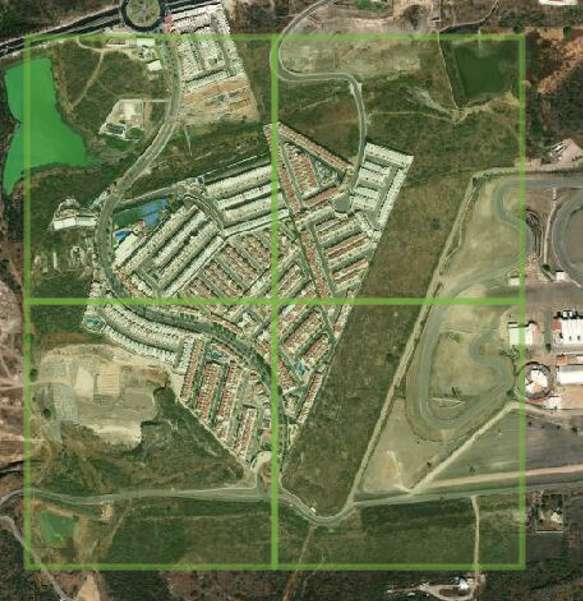
Take Puerta Real, for example. It went from non-existent at the time of Censo 2010, to a 2018 estimate of 1,589 households and 7,426 people. That’s no small impact, especially considering this is a predominantly C-class area with a smattering of A/B – groups that many consumer-facing brands find a profitable core demographic. (If you take a look at the embedded marketing materials and details from Puerta Real’s developer, you’ll see evidence of these social classes through the size, configuration and finishes of these new homes.)

If 7,000 “new” people sounds like a big deal to you, let us be the first to say, it’s not. Well, it’s not nearly as big of a deal as 121,275 people, which are the “new” residents detected just within our Growth Grids, and just within the SLP metro area. That’s a big deal. And San Luis Potosí is just one of dozens of growing medium-to-large cities across Mexico, places that once might have been an afterthought for multinational retailers but that have become respectable multi-unit markets in their own right.
On the south side of Aguascalientes city, tucked behind the gargantuan Nissan factory, sits an expansive new residential development geared towards the working class. Viñedos del Sur is a densely packed community, townhouse-style, with minimal amenities and scarcely even a tree. Yet despite this agglomeration of household (we estimate nearly 3,200), nobody who lives here shows up in INEGI data, though coincidentally, this neighborhood is just a 15 minute drive from INEGI’s national headquarters. That’s not to say it’s INEGI’s fault – they are not in the business of annual population estimates, and this neighborhood was bare dirt the last time a Censo was conducted in 2010.
Because INEGI is not set up for estimating the size and location of current-year population, at a micro-level, a different approach is required. GeoAnalitica’s solution to the problem of “invisible neighborhoods” relies on multiple change-aware sources that help us measure population changes at large levels (like, a municipio), and allocate those changes to the micro-areas in the community that have given evidence of population change. Sometimes that happens inside an AGEB, but sometimes there’s not even a shape on the map to reference. Viñedos del Sur, like so many other brand-new communities, gets assigned to one of GeoAnalitica’s 15,000+ Growth Grids, so that they can finally show up on trade area maps.
Adjusted Censo-type data gives a good estimate of people’s base demographics for the current year. But something more is needed to summarize their consumer potential and socioeconomic level. By tying in even more independent data sources, GeoAnalitica provides estimates that no other source can match, and at a micro-level. For example, in Viñedos del Sur and its neighboring communities, we’re seeing a predominant socioeconomic level of D and D+. Browse through some of our 360 degree streetviews from June of 2019, and we think you’ll agree.
Since Censo 2010, literally hundreds of thousands of young, growing families have set up homes in brand-new communities like this one. These families are the future of consumption in Mexico, and it would be tragic for marketers and retail operators and strategists to not know where and how many they are. Stay tuned to this blog for more examples, and reach out to us with questions about the growth areas in Mexico that you’re most interested in.
Tapachula, and Chiapas in general, doesn’t seem to get a lot of credit for the growth it has experienced. Tapachula’s fortunes are influenced by winds of change blowing northwesterly from Central America. (“Fortunes” might be a stretch…Tapachula is not quite the investment attractor that its cousins on the Northern border have always been.)
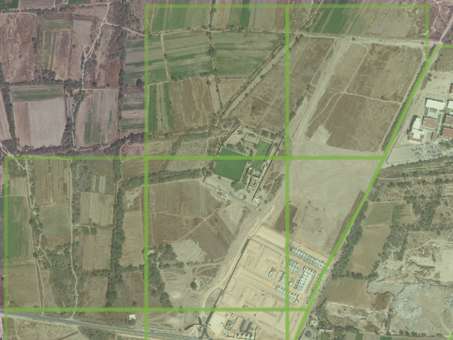
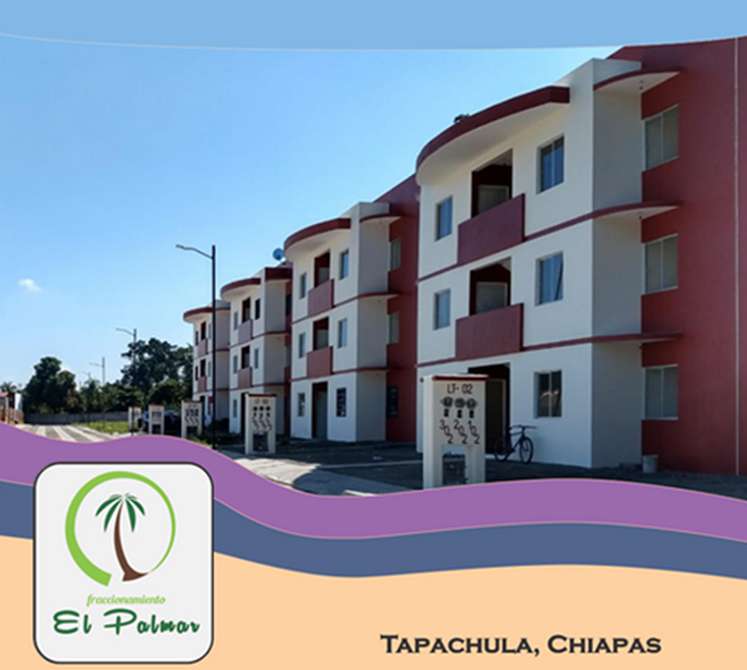
In Chiapas, master-planned formal development isn’t always the rule, so any time we can identify a new development by name, it’s interesting to take a closer look. One such development that worked its way through our Growth Grid identification process for 2018 is Fraccionamiento El Palmar, on the south side of Tapachula (where most of the city’s population growth has tended to cluster).
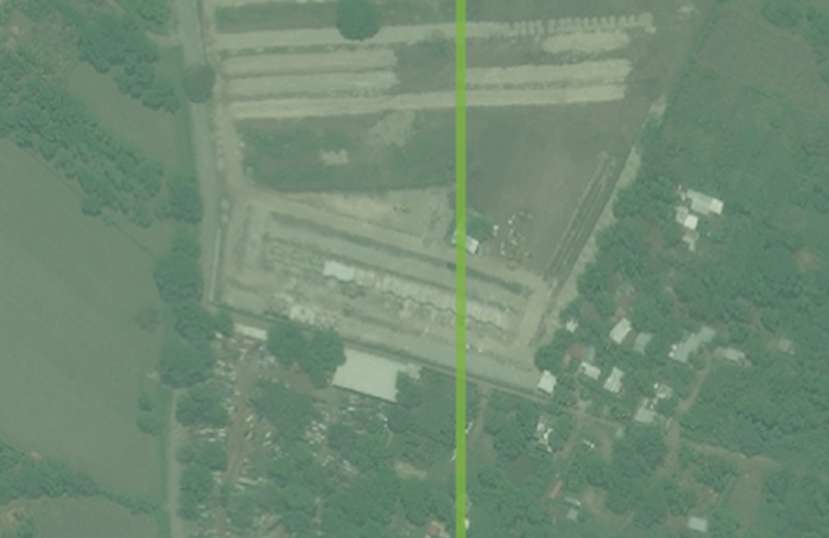
As a quick reminder, Growth Grids are boundaries that GeoAnalitica creates on its own, to encompass areas that have a residential population not covered by INEGI Censo 2010 – nor even encompassed by an INEGI boundary like AGEB or manzana.
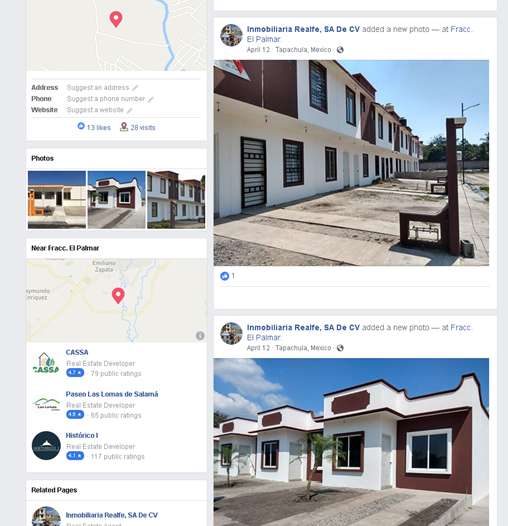
Back to El Palmar. This is not a lux development. In fact, GeoAnalitica’s socioeconomic estimates place it at a level E, the lowest possible. Not surprising, given that a good number of the developer’s promotional photos highlight running water as an amenity, or that their marketing efforts focus on a Facebook page and a Whatsapp number. Hey, no judgment – everyone needs a place to call home and it’s great to have developers serving low-income families that have missed out on the most basic of amenities.
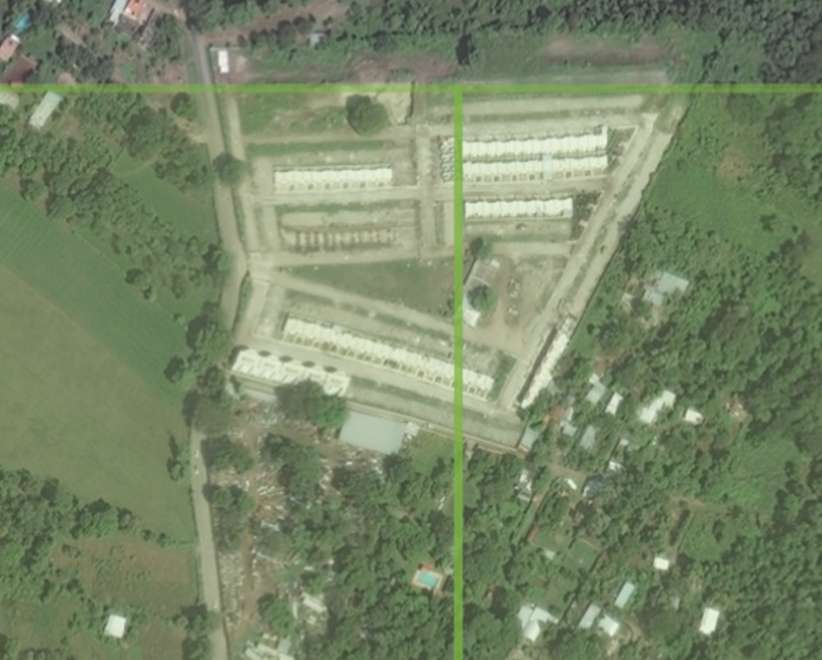
From what our research dug up, it looks like this development first started coming online back in September of 2018. It is still being marketed, which suggests that it’s working towards full occupancy.
Between the two Growth Grids it spans, we estimate 123 households for 2018. And, as mentioned, our process flagged the socioeconomic level of this area as a class E, the lowest possible score. Building permits on file with federal bureaus suggest an improbably precise 123 housing units within the development. (Out of modesty, it’s worth mentioning that our process is rarely 100% precise on household counts, so think of this as a relatively lucky guess by GeoAnalitica.)
Understand that Fraccionamiento El Palmar is relatively small for a master-planned residential development. Sure, it’s just over a hundred households, and furthermore, of a socioeconomic group that is not “big spenders”. Regardless, El Palmar illustrates an important point: new developments are being planned, built, marketed, and occupied on relatively brief timeframes. Not only is it important to have growth-aware snapshots like GeoAnalitica’s Mexico demographics to see how things have changed since Censo 2010, but it’s also important to what areas have grown even since last year. Keep checking in to our blog for similar stories in other areas.
On the south side of Cancún, in an area not covered by any INEGI AGEB or manzana, we see a new community, with a curious branding strategy.
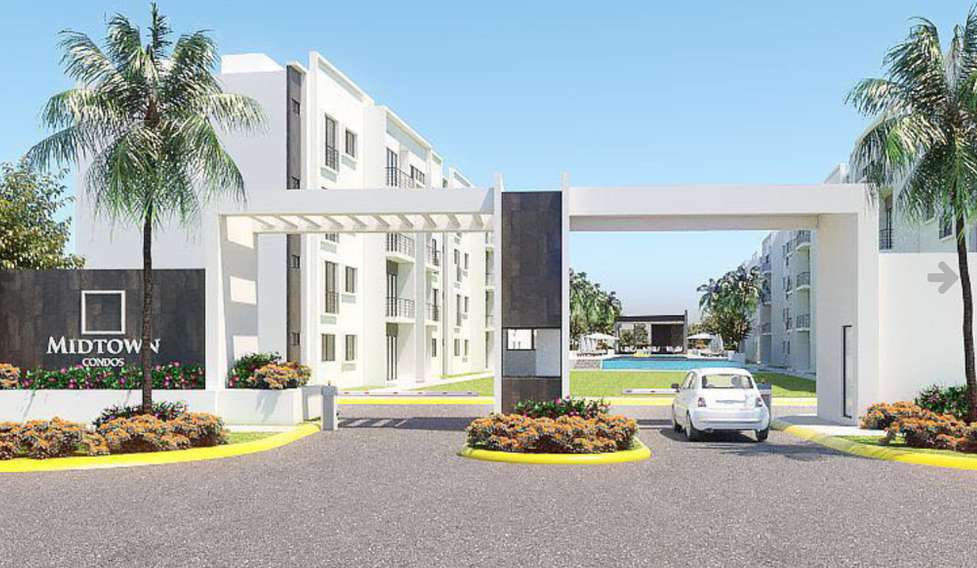
While lawyers and financiers in Manhattan dream of the sea breezes and relaxation of Cancún, a prominent real estate developer called CADU markets an Empire State of mind to young Cancún families starting off on their own. The “Long Island Comunidad Integral” development, and its constituent communities like Midtown, York and Kings, are New York-ish in name only. The perfectly palm-lined community pools and stereotypically perfect front entry gate remind you that you’re in a mid- to high-end Mexican residential development.

Let’s dig in to the basic history of the Long Island development. Frankly, it’s not a long history. Research shows the first press release regarding the development’s launch was published in 2017, nearly a decade after INEGI’s teams delineated the AGEBs and Manzanas that would be used as the geostatistical units for the Censo 2010. In other words, this 500m by 500m square of land used to be the middle of nowhere. But, a strong, publicly-listed developer coupled with a good macro-picture of growth in Cancún gave birth to a successful development that is still attracting new residents eager for a taste of luxury and the security of a gated-access community.

GeoAnalitica’s growth-detection process, which uses multiple third-party sources to quantify and allocate growth experienced in urban and near-urban areas, made a bold estimate for this newly identified Growth Grid in 2018: specifically, that there were 543 households in the area that did not exist at Censo 2010. CADU’s own published numbers and master plans indicate about 477 homes built. So, yes, nostra culpa, our estimates appear to be a little high…or perhaps just a little early.

There appear to be a couple parcels in early stages of development in the southeastern corner of this Growth Grid. Regardless, this is the kind of growth story that would remain invisible to users who rely solely on INEGI data to understand their market’s geographic distribution of households; it wouldn’t even show up on the map until INEGI’s next censal results are released sometime in 2021.
That presents a problem for consumer-facing businesses who are trying to plan their branch networks for today’s ground-truth. It’s a costly miss. So, while this is undeniably one of the more booming Growth Grids we’ve seen come up in 2018, it does illustrate what you could be missing if you’re not leveraging growth-adjusted GeoAnalitica demographic estimates for Mexico. Stay tuned to our blog as we explore other interesting growth stories that have cropped up in the past year or two.
Today, we’re excited to bring to market our newest Mexico data release. Our 2018-vintage demographic estimates carry the torch from prior years, utilizing a consistent growth-adjustment methodology fueled by the most recent data available. As always, our Mexico demographic data shed light on small-area changes in urban and semi-urban areas, whether or not there’s an urban AGEB shape outlining a given growth area.
First, let’s take an [admittedly oversimplified] look back on some of the driving themes of 2018. If we were to sum up Mexico’s 2018 in one word, it would definitely be AMLO. The dynamic between the government and the governed is changing, and the stories we’re hearing indicate that Mexico’s decision-makers and power-players spent much of 2018 unsure of the future of policy and how it might affect business investment.
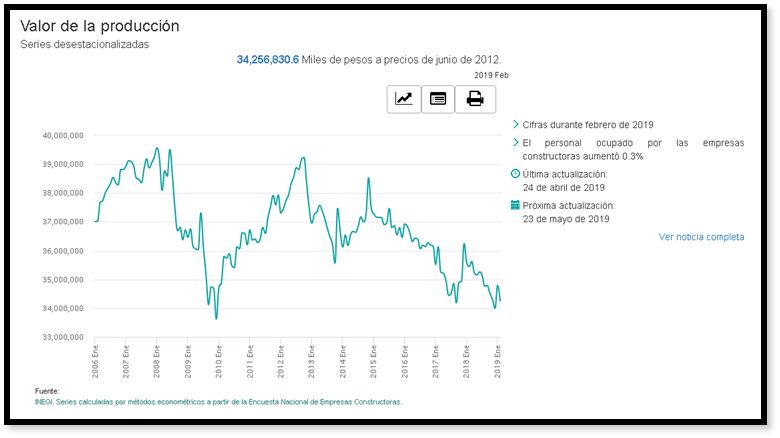
Whether causative or just simply correlated, our 2018 process identified fewer of the massive residential developments, the likes of which have characterized Mexican urban growth in prior years. This is consistent with the macro-level data we are seeing from INEGI’s observations of GDP by sector: the value of production for Construction Activity has reached about a nine-year low in constant pesos (see chart below or original).
Consequently, fewer Growth Grids (n=1572) were identified in the 2018 vintage compared to the prior year. While accounting for 170,000 housing units and 660,000 persons, the Growth Grids do not tell the entire story of growth for 2018. Continued growth in existing AGEBs, as well as in ‘legacy’ Growth Grids from prior vintages, accounts for the remaining 592,000 housing units and 2.3 million persons who have appeared in urban and proximal areas. Overall, GeoAnalitica’s data coverage has surpassed a symbolic threshold, with our total 2018 population count exceeding 100 million individuals for the first time. (As a point of reference, if users were still relying on Censo 2010 AGEB data, they would only be seeing 86 million individuals. The GeoAnalitica approach has identified the equivalent of an extra one-and-a-half Mexico Cities across the nation since 2010.)
With regards to the socioeconomic picture, changes versus the prior data vintage are not dramatic. The macro-picture described by many leading think-tanks seems to confirm what we see in the micro-picture: mainly, that new household formation among the lower socioeconomic rungs is occurring faster than upward social mobility can keep up with it. Mix in a housing financing system that is subsidized for lower income families, and it’s no surprise that new household growth is tilted toward mid- and lower-mid tier households.
To close this out, we invite you to think of this blog post not so much as the end of a story, but more like the prologue. The real story plays out in Mexico’s AGEBs (and outside of them, too), where real-life people are setting up homes and building their own communities. Whether you know who’s there or not depends on the data you’re using, and whether it was designed to seek out and quantify population growth. We can’t wait to share some of the stories we’re seeing in GeoAnalitica’s Mexico 2018 demographic data.
2018 totals for GeoAnalitica’s coverage areas:
As we prepare for our 2018-edition Mexico demographic data release, GeoAnalitica is happy to report an exciting new development that will empower a new audience of users with growth-adjusted geodemographic data.
We are honored to have Sistemas de Información Geográfica, SA (SIGSA), Mexico’s leading provider of GIS software solutions and services, on board as the distributor of our data products in Mexico. With this relationship, we look forward to adding even more value to SIGSA’s powerful GIS solutions, making possible a whole new level of demographic analysis for some of Mexico’s most innovative and recognized companies. Likewise, SIGSA’s expertise in crafting GIS solutions will open new doors for many of our would-be clients who, until now, have lacked the software and support needed for a world-class GIS deployment. We are excited to launch this new chapter together!
This is also a great time of year to offer a “sneak peek” of our upcoming 2018-edition data release for Mexico. We are seeing lots of exciting changes on the ground, with nearly 800,000 new households identified, many of which are in the 1500+ new Growth Grids covered exclusively by GeoAnalitica. Since debuting in 2016, the Growth Grids system of proprietary geographic boundaries has identified more than 8 million people that no other dataset includes. (That’s in addition to the 6 million new residents we’ve identified in legacy AGEB boundaries.)
For the first time, GeoAnalitica’s estimates for urban and near-urban areas of Mexico have topped 100 million people. In contrast, 2010-era data only counted 87 million people. While that’s a huge difference at the national level – almost like adding an extra Estado de México -- the most exciting differences are at the neighborhood level, where raw land is being developed into thriving, dense communities. retailers and marketers need to know about. These are fascinating growth stories that retailers and marketers need to know about.
Speaking of which, we continue to plan new research trips to some of Mexico’s most dynamic cities, capturing real-life scenes from the new communities identified in our datasets. We look forward to publishing our stories about these exciting new growth areas through our blog, so stay tuned to see our results.