Anyone who pays attention to the demographics of Mexico knows that residential development can be verge on the erratic. In a medium-sized city, you may see a plot of brushy, vacant farmland transformed into a community of thousands in just a few months. Then, you might not see any new development in that city for years afterward. The on-again, off-again tendencies of large-scale residential development on the fringes of urban areas makes growth tough to keep track of, and makes a growth-aware Mexico demographic data product a must-have for consumer-facing companies that need to be on the leading edge of growth. We’re going to the medium-sized city of Poza Rica de Hidalgo, in the state of Veracruz, to look at Fraccionamiento Kaná.
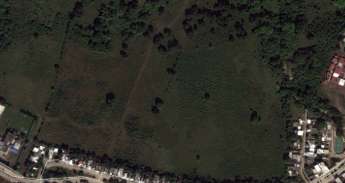
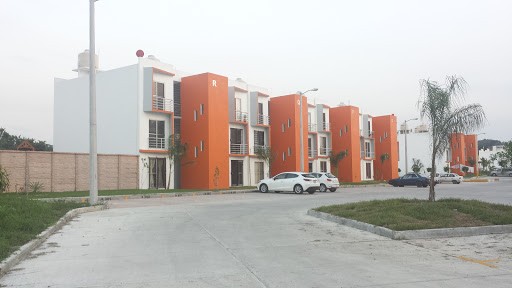
Fraccionamiento Kaná is a working-class housing development on the eastern edge of the city. Back in 2010, during the Censo, this particular piece of land was totally vacant. There wasn’t even an urban AGEB drawn to encompass it. However, development went underway sometime in 2014, eventually resulting in what we estimate to be 644 households containing 2,400 individuals. The developer's website, apart from giving us some cool photos to document what Kaná looks like, confirms that the development is 100% sold out.
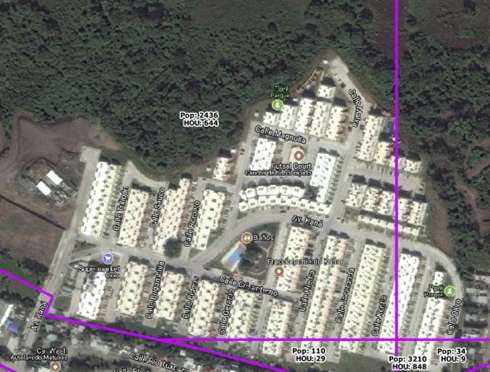
Within Kaná, we see a very low household income in our data -- MXN$119K, or about 60% of the national average. We see consistency between that figure and the original pricing of the housing units in this fraccionamiento, which ranged from the mid MXN$400k range to MXN$880k. As in other parts of Mexico, we are seeing developers building stylish housing for the lower socioeconomic rungs (in this example, D+), which we believe is part of the equation to get governmental support and subsidy eligibility.
While this development itself may not make or break the case for retailers deciding whether Poza Rica is the right fit, it’s just one Growth Grid out of the 15,000+ that GeoAnalitica makes available as a demographics add-on. Our Growth Grids data tell you things about your markets that INEGI’s data cannot, because our methodology is designed from the ground up to find and measure residential growth. We think Kaná is a cool story, and a great example of the kind of development that you discover using GeoAnalitica data as part of your market research and site selection process.

Part of updating our Mexico demographic data is “fact checking” the new residential growth areas that have appeared in our Growth Grids Add-on product. When we completed our 2017 demographics review, we handpicked a few of these growth stories to put in context through a blog post. Today, we’d like to take you to Pachuca, Hidalgo, to look at a growth area that’s home to more than 15,000 people not appearing in any other Mexico demographics dataset. Welcome to Los Viñedos.
Los Viñedos is a series of developments, spearheaded by Grupo RI Comercial, with each new phase named after a different wine country or varietal. “Marsala” took root in 2013, followed the next year by “Loire” and “Chianti”. The biggest push came between 2016 and 2017, when “Abruzzo” and “Piemonte” spanned the physical gap between earlier phases with nearly a square kilometer of dense residential development. Infill continues, with “Florina” and “Orvieto” showing signs of ongoing development in the most recent remote sensing imagery we’ve seen.
The names of these phases may be fanciful, but don’t let that fool you. These developments are as real and solid as the concrete block that built them. With an estimated 4,700 households centered around these developments – none of which fall within an INEGI AGEB, and none of which had been formed at the time of Censo 2010 – Los Viñedos creates its own center of gravity for retailers serving the mid-to-lower end of the socioeconomic spectrum. (Depending on which wine varietal you look at, AMAI classes are generally D+ or C-.)
What’s interesting to us about Los Viñedos is something that’s common to so many mega-developments in Mexico: the years-long lag of retail development built in proximity to these residential developments. Besides the occasional abarrotes or neighborhood storefront, the nearest significant retailer – a Bodega outlet – is nearly a mile away in an older, established neighborhood. While the wheels are probably in motion with the majors to develop convenient formats close to this community, the fact that there’s been nothing for the first five years is a warning sign to all those using INEGI Censo 2010 results as their sole data source. INEGI’s census program measures a single point in time, once per decade. Meanwhile, GeoAnalitica’s Mexico demographics are measured once per year, without being constrained to the same old AGEB boundaries. It really does make a difference.

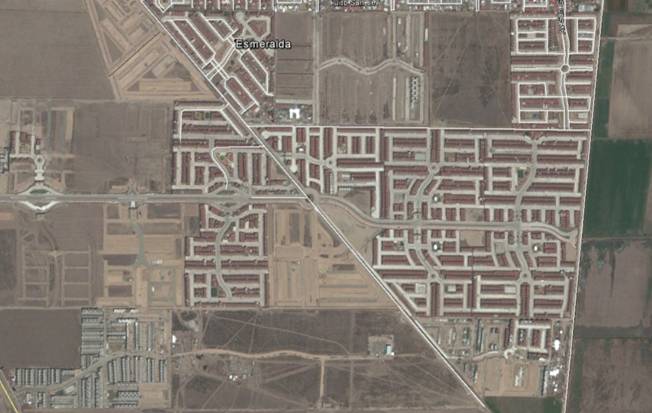
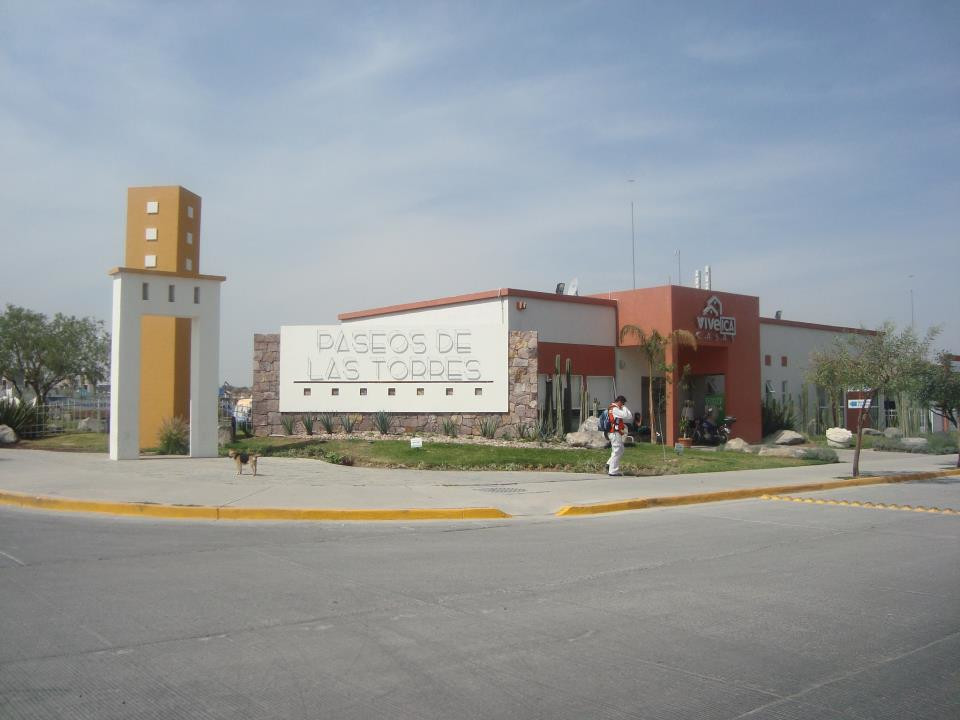
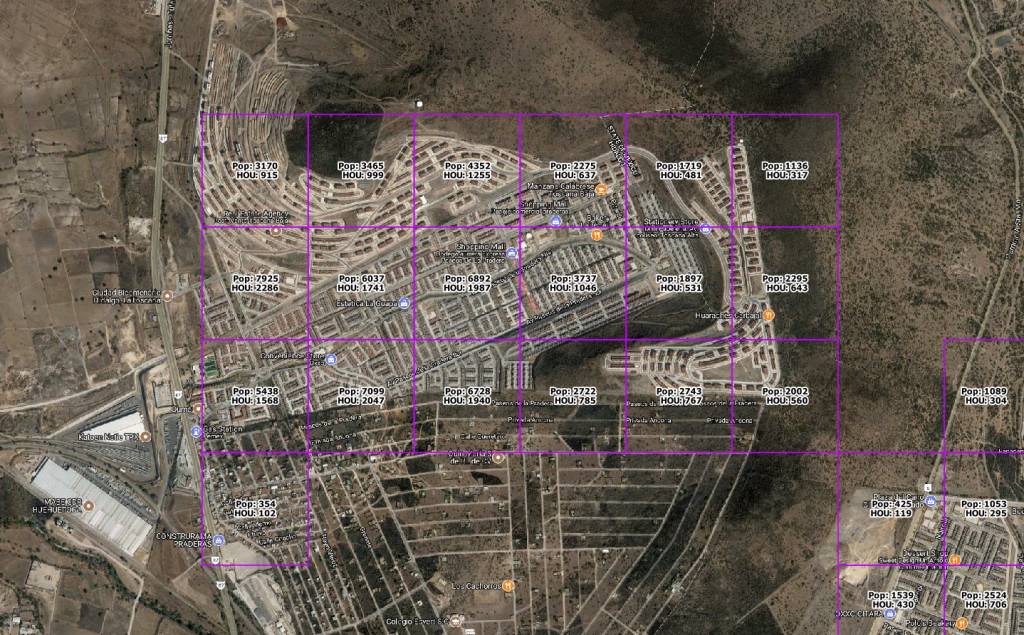
Standing in the middle of what was very recently a patch of bare dirt, a community of 29,000 people can now be seen – if you know to look for it. Unfortunately, Censo 2010 demographics won’t even show that this community exists, because development didn't start until after the demographic data were collected. On the other hand, Geoanalitica’s Mexico demographic data build process is adept at detecting and measuring growth stories like this. Let’s take a look at the history of the 7,000-household community centered around Paseos de las Torres, a sprawling residential development in northwest of León, Guanajuato.
Paseo de las Torres first began taking shape in 2009. Although this was the year that INEGI delineated the AGEB boundaries that would become the focal point of Censo 2010 a year later, there are no AGEBs drawn around this under-development project. The nearest urban AGEB is over a mile away, which is not uncommon with mega-developments that require lots of easily titled and inexpensive land.
Paseo de las Torres probably began to see its first residents move in sometime during 2010 or 2011, too late to fill out their Censo 2010 questionnaire – not that it would have mattered much, without an AGEB for INEGI to summarize their data into. And, within a short span of time, neighboring communities began taking form. First, there was UrbiVilla del Roble (circa 2012), followed by Brisas del Campestre (circa 2013), and Katania, Danubio Azul, and La Querencia (2014-2015). There’s still construction going on currently, with Residencial Cordillera expanding even during 2017.
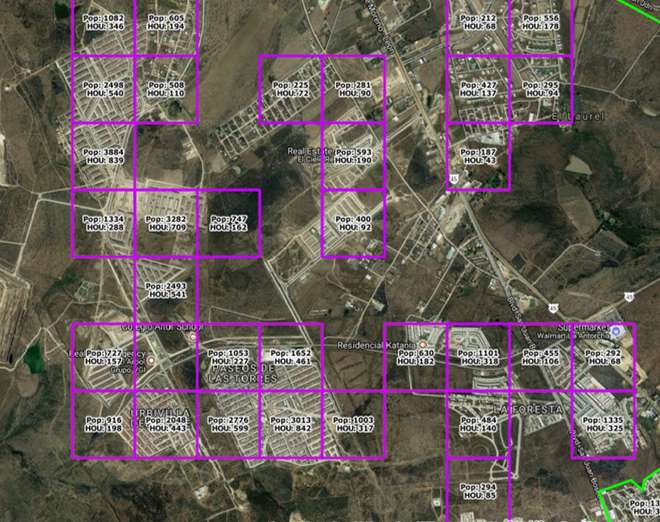
Apart from growth, GeoAnalitica also estimates the socioeconomic class that best describes each Growth Grid. In this part of Leon, we see a mixture of lower-spectrum classes, with heavy presence of D, D+ and C- households. There’s a smattering of C and C+ households (some of the most recent developments could be described as “affordable luxury”). In all, we see household annual incomes ranging from MXN$160k to MXN$260k in this area, which reassures us that there is indeed a consumer presence in this community.
The scale of growth is staggering. The past seven years of development in this corner of León could be enough to sustain a large, localized retail presence. Yet, our analysis of retail in this area shows just a Bodega store, an Oxxo, a pharmacy and a pawn shop – and all of these are in the “oldest” part of the development. Opportunities are being missed simply because these developments are too new to appear on INEGI demographic maps.
While the Paseo de las Torres example is noteworthy, it’s certainly not unique. There are thousands of growth stories unfolding nationwide, many of them dealing with thousands of households themselves. GeoAnalitica is the only data source that is programmatically identifying and measuring these growth stories as part of our annual, updated Mexico demographics packages. Keep checking out our blog for new growth stories, or get in touch with us for customized insight that could help your organization avoid missed opportunities.
In 2018, it seems like “more” is always better. More options. More insights. More data. But when it comes to Mexico demographic data, some users would rather have a high-level view. That’s why we occasionally get requests for Mexico demographic data at the municipio level, a notch or two less granular than our main product goes.
You may be thinking, why would anyone want to look at something less granular than, say, an AGEB or a localidad? There are a few good reasons, and they all revolve around what we call “fit for purpose”. In other words, a strategic choice to use municipio shapefiles and demographics to solve a particular analytical need or fit into an existing business process. There are also some not-so-good reasons that have become so ingrained in organizations’ GIS analytics that there’s a lot of anxiety about using any other geographic unit. Let’s talk about some of the most common reasons – both the good ones and the bad ones -- to rely on the municipio as the geostatistical unit of choice.
There are some perfectly valid reasons to use municipio demographics for Mexico as the sole data source for business decisions. One of them is mapping – serious, old-school cartographic layouts designed to make a visual impact to help decision-makers understand the geographic context. When it comes to mapping AGEBs, Manzanas or even our proprietary Growth Grids, good luck making a national-scale or even a state-scale thematic map to show comparative demographics. The reason is simple: these urban geographic units are really small, very numerous (56,000 AGEBs nationwide), and only cover a fraction of Mexico’s territory. They were not really designed for big-picture analytics, but rather, small-area analysis, like looking at a trade area or an urbanized zone. Mexico’s 2,400 municipios make for a much more impactful thematic map to give general context to high-level decision making. (Nonetheless, there’s lots of potential for error, mainly because the geographic extent of a municipio has little relationship to the magnitude of the population residing within it.)
One other very good reason to rely on the municipio is the availability of ancillary data. Unlike an AGEB, which is a purely geostatistical unit used for census counts and analysis, a Mexican municipio is also a political unit. Municipios have their own elected governments, who provide municipal services, and in the process create a large volume of data, much of which has become easily accessible over the past few years. Need to analyze the number of vehicles on the road in an area? You can grab this data at the municipio level. Same goes for crime data. A municipio is the lingua franca of Mexico’s open data initiatives. What’s more, some organizations make their own data at the municipio level (for example, customer intercept data).
There are also a few bad reasons to use the municipio as the main geography in a business process. First of all, there’s habit. For a long stretch of time, most of the demographic data that could be downloaded, bought or licensed was at the municipio level. Traditionally, this was called Admin 2 level data (in the geostatistical hierarchy under Admin 0 and Admin 1 – respectively, the national boundary and state boundaries). If you look at the main GIS platform providers, all of them will resell a plug-and-play municipio dataset of some sort, nearly always dating back to Censo 2010. Once those 2,400 municipios become ingrained in a corporate process, it’s really hard to switch away from them.
Another poor reason to turn to municipio data for Mexico is to conserve resources. That goes in a couple of directions: municipio level data can be less expensive than AGEB data (though not always) and take up a smaller footprint as a .shp or .tab file. Both of those reasons were valid a few years ago, but times have changed. Many muncipio demographic datasets are now as expensive, or even more expensive, than similar AGEB-level data, yet they are still stuck in a time warp at Censo 2010. Meanwhile, GIS platforms and the hardware they run on have advanced to the point where dataset size no longer makes much of a difference. Local copy or in the cloud, a 70,000 feature dataset like GeoAnalitica’s loads in seconds. Program crashes like we used to experience back in the early 2000’s are now a rarity, rather than the norm. The costs and tradeoffs of micro-level geodemographic data have improved dramatically, and the real winners are everyday users.
What’s GeoAnalitica’s position? We are, first and foremost, a micro-level data provider for Mexico demographics. Our methodology specializes in urban areas, and our philosophy is centered around enabling small-area spatial analysis. That said, we believe in empowering users to chart their own course. We believe that municipio-level data for Mexico is a supplement to AGEB and Growth Grid data, rather than a substitute for them. As such, we work with our clients who require municipio data on a customized, needs-oriented basis. While that means we don’t have a municipio-level product in inventory, it also means that an engagement with GeoAnalitica helps clients meet their unique objectives with a holistic, total solution.
If you’ve stuck with this blog post this long, we’re probably speaking your language. If you’re struggling with municipio-level data, or searching for a solution that’s more tailored to your unique analytical needs, there’s a chance we can help, so reach out to start the conversation with us.
It’s human nature to push boundaries. In the location intelligence world, that’s part of what we all do every day. There’s probably not a business analyst or GIS analyst out there who hasn’t used a dataset to solve a problem it was never meant to solve. That creative repurposing of data is part of the fun of what we do, but it never seems to work quite as well as using a purpose-build data product.
Demographic data that comes from a census is the first thing that comes to mind when thinking about repurposed data. While many census programs release demographic data and geospatial boundaries to end users, these datasets don’t often come with all of the footnotes that they merit. That’s why we want to spend this blog post highlighting some of the risks that come with using straight-up, unadjusted census data to guide business decision-making, using Mexico census demographic data as a focal point.
Mexico demographic data are released every time INEGI conducts a decennial census. (INEGI is Mexico’s national statistics bureau, which manages the Censo program as well as a number of surveys, macroeconomic indicators, and other statistical and geographic programs.) Nowhere in INEGI’s charter will you find a dedication or shout-out to the business community; it’s very much a public institution whose core mission is to serve the public. The whole point of a census is to take a snapshot of the population and its characteristics, so that policymakers can make informed decisions about where to allocate resources. (Admittedly, that’s a major oversimplification, but it really is true.)
Here’s another oversimplification: policy moves slowly, and doesn’t need the latest and greatest data. The cost/benefit equation when it comes to conducting a nationwide 100% census count seems to balance out at 10 years, which has become the norm. Businesses, on the other hand, move much more quickly than policy. It’s hard to think of a single piece of 10 year old data being entertained in a boardroom: for business leaders, that 10 year lag might as well be a century. Yet, every day, in boardrooms and real estate committee meetings, that’s exactly what’s presented when it’s time to talk market analysis or trade area modeling. This isn’t groundbreaking news by any means, but it’s something that many analysts and executives have grown accustomed to: complacency with using outdated data, and trying to make up for stale data by relying on anecdotes, conjecture, or brokers’ stories to fill in the gaps on a one-by-one basis. This reality is frustrating at best, but can also be just plain wrong.
Mexico demographics from INEGI are not designed for the temporal resolution or update frequency that fast-moving, competitive businesses require. A purpose-built Mexico demographic data tool, that bases itself on the census but incorporates multi-source information on the size and location of growth, can offer answers and inform decisions with greater fidelity to what’s really happening on the ground. Building that data has been GeoAnalitica’s mission since day one.
Now that Mexico’s Censo 2010 is approaching 8 years old, there’s never been a worse time to use its results to plan markets and trade areas for today or tomorrow. GeoAnalitica’s Mexico demographics offer a snapshot of the urban population once per year – even for areas that INEGI’s Mexico demographics don’t have on the map.
We’re not saying INEGI data is wrong, nor are we saying that GeoAnalitica’s Mexico demographics are right for every purpose and need. We just want our user community to remember fit-for-purpose, and to understand that different datasets are destined to solve different kinds of problems. Next time you find a piece of 2010 data sneaking into your analytical process, give it a moment and think: does the age of this data present any risks, and is there something more recent out there? An informed decision is more likely to be a good one.
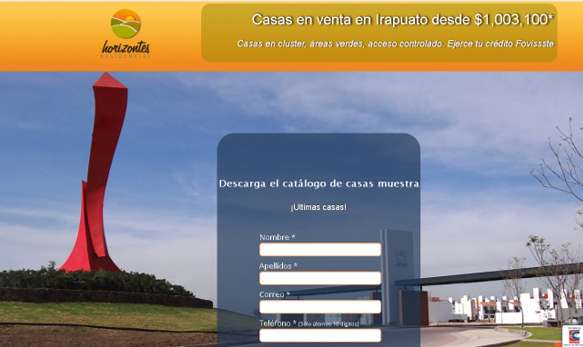
This is the time of year when GeoAnalitica releases the latest vintage of Mexico demographic data. This year’s release, covering 2017, has discovered over a million people not covered by other data sources: neither by INEGI’s Censo 2010, nor even GeoAnalitica’s own 2016 Mexico demographics. There are growth stories unfolding across Mexico every year, and if you’re not looking for them, you’re unlikely to find them…well, you’re unlikely to find them before Censo 2020 results roll out to the public, sometime in 2021 or 2022. We chose a handful of these growth stories to blog about, so you can see how GeoAnalitica’s Mexico demographics paint a picture of what’s really happening on the ground today.
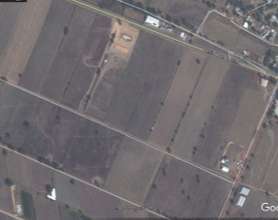
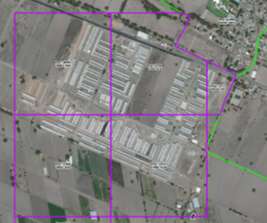
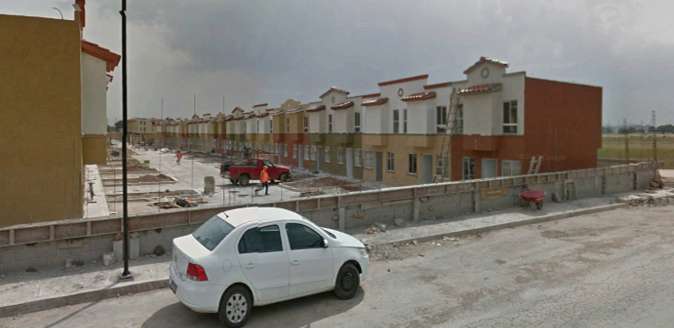
In today’s blog, we’ll do a walkthrough of Horizontes Residencial, a new development on the outskirts of Irapuato, Guanajuato. Horizontes is a modest (dare we say small?) community of 900 households and 3,200 people. Four years ago, this was an agricultural field on the southwestern fringe of Irapuato. Massive, planned development by COMEBI took place quickly, and may be ongoing even today. If you’re using INEGI AGEBs and Censo 2010 demographic data, this area would have never shown up on your screen.
Besides identifying growth areas’ location and size, GeoAnalitica’s process also estimates these areas’ demographics. In this case, we see mixes of C and D class, consistent with what the developer publishes as the list pricing of homes (starting at MXN$1million). GeoAnalitica also estimates an income level for this area – MXN$196K, to be exact, just short of the national average income.
What can we say about the future of Horizontes Residencial? Time will tell. The community could be completed and fully occupied this year, with no further development, or the surge of construction may serve as a nucleus for newer, as-yet-unseen developments that piggyback on the new infrastructure put in place for Horizontes. Either way, GeoAnalitica’s robust change-detection mechanisms ensure that users won’t have to wait more than a year to get the details.

Too many of Mexico’s biggest and best consumer-facing businesses have lost competitive battles to smaller, regional players who benefit from “real time” knowledge of what’s developing, and where, and when. National players need the right tools to confirm and evaluate what they’re hearing from their developers, field staff and operators. Reach out to us to see if our data for the thousands of stories like Horizontes Residencial could help your organization get the competitive advantage it needs.
Recently on the GeoAnalitica blog, we’ve been digging deep into some of the thousands of growth stories taking place in our Growth Grids Add-on dataset, to show how this product helps fill in the gaps left by Mexico Censo 2010 demographics. Because Mexico AGEBs were defined by INEGI for a particular purpose, at one point in time – the compilation of Censo 2010 data during the summer of that year – they are ill-suited for looking at the way your Mexican markets look today. Our Growth Grids are proprietary boundaries that look beyond AGEBs to find growing areas, and then provide true-to-ground demographics estimates for these exciting growth areas.

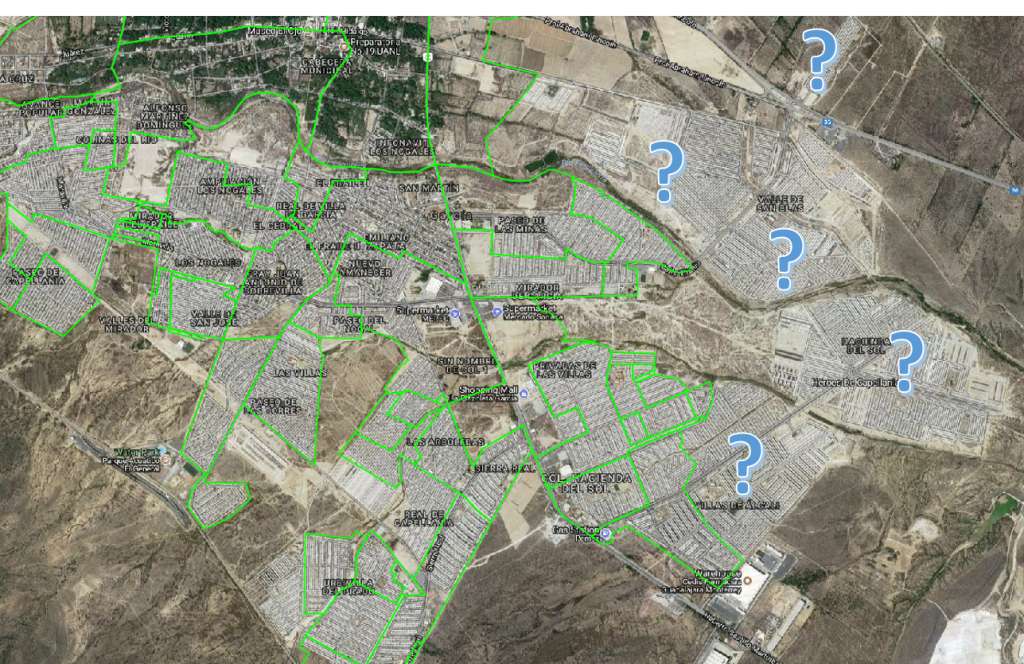
Today, we’ll be zooming in on the municipality of Tecámac, in Estado de México. Straight north of Mexico City proper, Tecámac is a heavily populated municipio. Interestingly, some of the greatest growth has not been in its most populous localidad (Ojo de Agua), but rather, in some of the smaller outlying localidades. This growth story takes place near Santa María Ajoloapan.
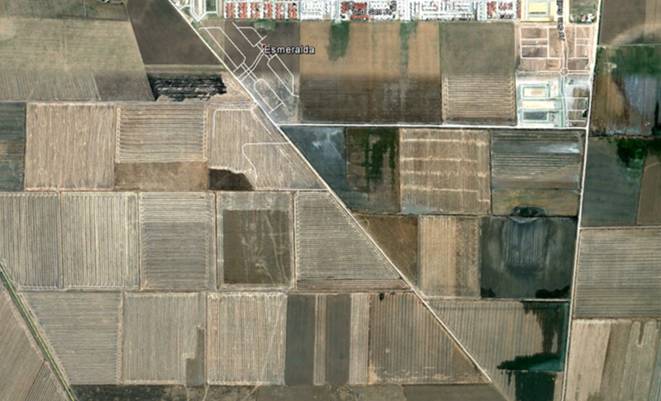
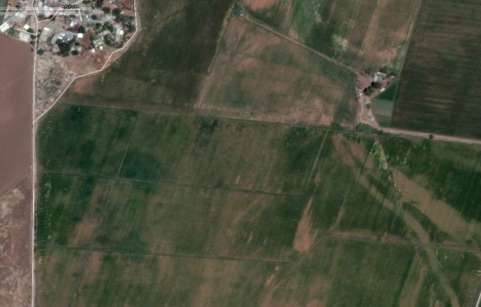
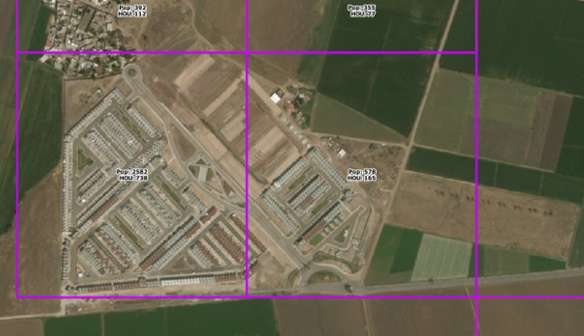
Fraccionamiento Real Granada is a sprawling new development, breaking ground in sometime in 2015, but not noticeably occupied until 2017. In that short span of time, nearly 2,500 households have been formed, home to more than 9,700 individuals. Because it was nothing but farmland in 2010, there’s not a single INEGI AGEB that touches Real Granada.
Apart from measuring the mass of people living in this new development, what can GeoAnalitica data say about their characteristics? Our process imputes demographic estimates for all of the Growth Grids that we define, ranging from age and education to income and socioeconomic class. In Fracc. Real Granada, our change-aware data sources lead us to believe this is a D/D+ neighborhood, on the lower end of middle class in Mexico.
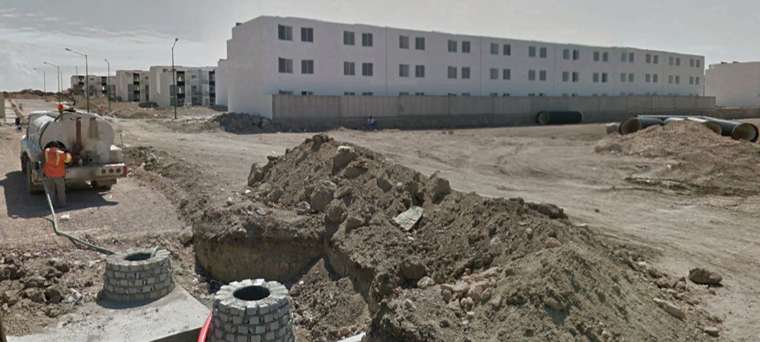
This development is so recent that even Google’s StreetView cars have not had a chance to drive it completely. A snapshot from 2017 seems to show dense, multilevel housing under development, while aerials show communal parking lots. The developer’s webpage is replete with links to the various government housing subsidies that can be applied to the MXN$500k starter home prices. GeoAnalitica’s Income and Expenditures product suggests an average household income of around MXN$186k, less than the national average.
While Fracc. Real Granada has experienced booming growth in the past two years, you wouldn’t have noticed it in your Mexico census data. You might not have even seen it on a market tour, unless you had take a detour across the miles of farmland surrounding this new development. GeoAnalitica’s current year Mexico demographic data, and the Growth Grids that complete the package, offer you a way to understand the location, magnitude and context of exciting new residential developments like Real Granada.
One question that we get – rarely, but occasionally – is on the availability of manzana level GIS data for Mexico, whether that’s manzana boundaries or manzana demographics. There are more than a million manzanas delineated by INEGI, covering urban areas. While that alone sounds like a compelling reason to use these shapefiles for demographic analysis, there's more to the story. Let's dig into what a manzana is, what it does, and why (or why not) you should be using them.
Manzana is an interesting word in Spanish, in that is has two very different meanings. On the one hand, a manzana is an apple. But, of more relevance to GIS analysts, a manzana is a block (as in, a city block). It even leads into the word amanzanamiento (a tongue twister for sure), which is often used at INEGI and other Latin American census bureaus to describe the process of dividing up urban territory into statistical units that are generally really small.
How small? The coy answer is “smaller than they need to be”. For census users -- by that, we mean hardcore demographers who are mostly in the public or academic sectors -- smaller is better. There is a select academic elite that has access to microdata, otherwise known as household-level raw data from the original Censo 2010 questionnaires. Everyone else – business users included – only has access to summary statistics, meaning an aggregation of household-level data into a geostatistical unit (like a municipio, a localidad, an AGEB or a manzana).
The problem with smaller geostatistical units, and particularly the manzana, is the privacy protection mechanism used by INEGI, along with virtually every census bureau facing similar pressure to prevent misuse of personal data. For very small geostatistical units, ancillary demographic data such as age, indigenous status, or access to poverty-oriented social benefits could be used to pry into someone’s personal, private details. Nosey neighbors, potential in-laws, creditors or criminals could potentially use these details to the detriment of the respondent. For example, when INEGI rolls up Censo 2010 data to the manzana level or AGEB level, it zeroes out any demographic indicator with fewer than 3 persons counted. Note that INEGI does not zero out the main “mass” counts: population count and household count.
While that seems like a rarity, it can make a big impact on your demographic data analysis. These false zeroes move through the process undetected and can wreak havoc on calculated variables. Say, for example, you wanted to calculate the percentage of total persons who are age 50 or older. By summing the variable for age 50+, and then dividing that count by the total population, you have a synthesized, lower-than-reality numerator divided by a real-world denominator, potentially leading to a smaller percentage than you’d expect.
While AGEBs are subject to the same privacy protection mechanism, the fact is that there are dramatically fewer AGEBs that qualify for privacy protection. The mechanism affects at least one variable in 98% of manzanas, yet only 32% of AGEBs.
While manzanas are a really interesting, fine-grained level of geography for demographic analysis, they come with too much baggage. Their small size may give users a false sense of security that the data will be more accurate, but when it comes to any numbers besides mass counts, they leave information off the table. While these challenges have led GeoAnalitica to discontinue manzana-level demographic data as a standard product, we do realize that every client has unique needs and processes. We continue to work with manzana data to create custom, tailored products to serve specific client needs. If you’re thinking about manzana level data, or are curious how AGEB data stacks up, we’d love to have that conversation with you.
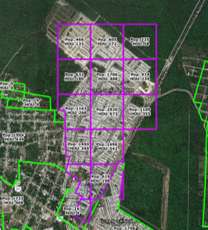
Mexico Censo AGEBs are a great tool for location intelligence, but they don’t tell the whole story. To fill in the gaps, GeoAnalitica developed a process to create Growth Grids, boundaries that encapsulate areas of new growth beyond the urban boundary.
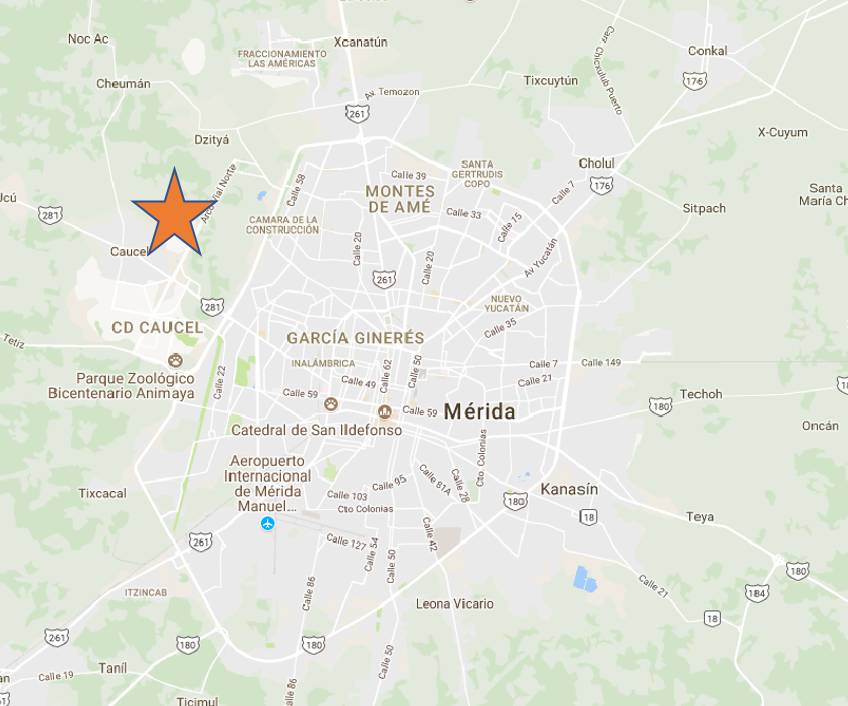
As we roll out more than 3,000 new Growth Grids for 2017, we’d like to zoom in on a few of them as an example of the types of change detected by our demographic data build process. This series of blogs will cover a handful of growth stories that have unfolded since INEGI Censo 2010 demographic data was collected and published nearly a decade ago. Today, we fly to Mérida, to take a look at a growing community on the western periphery of the urban core.
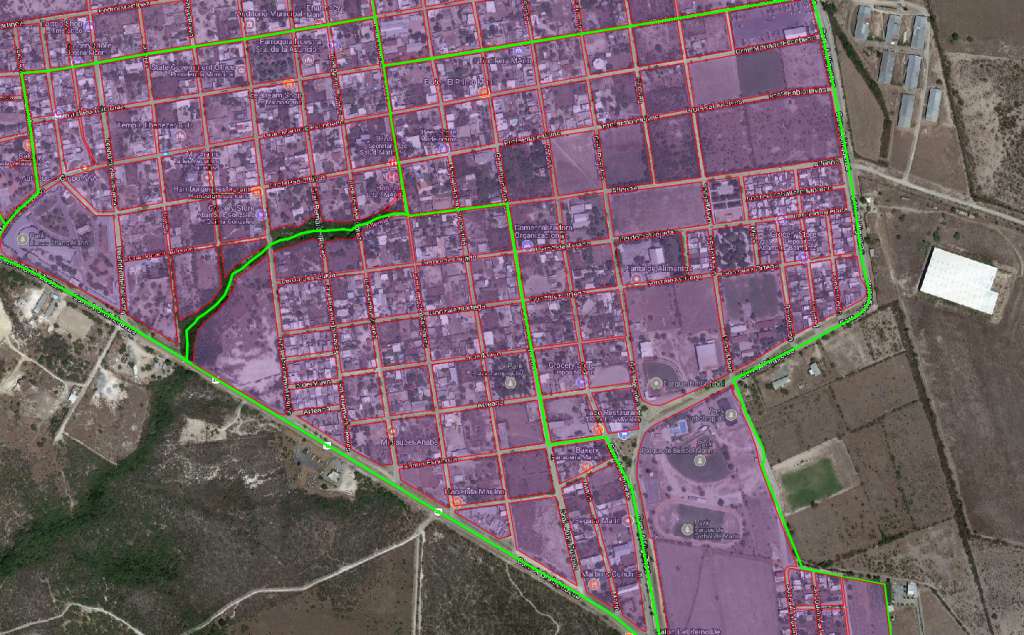
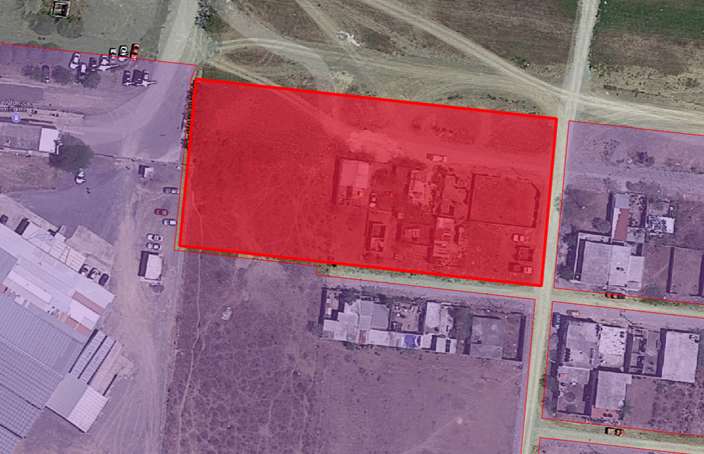
Gran Santa Fe Norte is not an old community. In fact, it didn’t even exist back in the summer of 2010, when INEGI Censo field personnel were out tabulating census data. It wasn’t until 2011 that new roads were paved into the humid Yucatán landscape, and new homes started to take shape. Since then, there has been constant construction, as new phases of the community are launched. Even in 2017, we are discovering newly built, newly occupied corners of Gran Santa Fe Norte that weren’t there the year before.

Identifying ‘where’ growth is occurring is a valuable advancement over Censo 2010 demographics. Quantifying the scale of growth takes things to the next level. Our process, which relies on multiple sources of change-aware data to allocate new household formation across a city, estimates about 3,900 households in the Gran Santa Fe Norte community. That’s about 14,000 people living in an area that, according to Censo 2010 data, is still a patch of jungle. Growth at this scale is too important to ignore.
Growth in mass is one thing, but how can we understand the context? Particularly, what kinds of families are living in Gran Santa Fe Norte, and where do they fall on the socioeconomic spectrum? GeoAnalitica’s process incorporates multiple primary data sources that shed light on the characteristics of these households. Evidence seems to point to Gran Santa Fe Norte being a generally “C+” community, with an estimated average household income of MXN$296k per year – some 40% higher than the national average. A quick peek on the ground – courtesy of Google StreetView – shows well-kept houses, ungated streets, and modest late-model cars…the hallmark of a middle-class Mexican residential development.
As alluded earlier, the story is not yet over for Gran Santa Fe Norte. The community has been growing and developing for six years straight, and it’s anyone’s guess what happens next. When researching an area that is experiencing great growth and change, it’s important to use a demographic dataset capable of detecting and measuring that change. GeoAnalitica’s Growth Grids technology is one way to keep informed of important growth stories like this one, which are unfolding across Mexico every year. Stay tuned for more blogs that take a closer look at notable developments like Gran Santa Fe Norte.
GeoAnalitica is pleased to announce this week’s release of our 2017 vintage Mexico demographic data estimates. We employ a unique methodology that uses multiple change-aware data sources to pinpoint the location and magnitude of population growth, and use that information to adjust Mexico demographic data to give the most realistic growth-adjusted picture of all of Mexico’s urban markets.
Covering core demographics as well as income and expenditures, these newly released datasets go beyond traditional INEGI AGEB boundaries. Our proprietary Growth Grids system not only maps out boundaries for growing areas outside the urban core, but also populates them with demographic data uniquely tailored to their situation. With GeoAnalitica Growth Grids, there’s no need to wait until Censo 2020 to see where growth is occurring. And there’s no need to rely on anecdotal information, either. Our system gives you quantitative data that you can leverage to plan your real estate strategy for the way things are today, not the way they were a decade ago.
Let’s round out our blog post with a few numbers pertaining to GeoAnalitica’s 2017 Mexico demographic data release. With this important new growth-adjusted dataset, we now cover more than 98 million persons across 25 million households. Our Growth Grids – now about 15,000 boundaries in total – encompass more than 8 million residents in communities and neighborhoods that would otherwise not even show up on the map. (That’s apart from the more than 3 million new residents we’ve detected in existing INEGI AGEB boundaries.)
If your business strategy could benefit from knowing the whereabouts of 11 million new people in Mexico’s urban markets, then our 2017 Mexico demographic data might be a good fit for you. Reach out today to line up a data test or to get answers to your unique questions and needs.