As you explore Mexico demographics and Mexico GIS data in more depth, you’re going to see some unfamiliar names pop up. You may be accustomed to the U.S. model of Census demographic areas: the tract, the block group, and the block, among others. While these don’t directly translate to Mexico Census demographic geography, they’re a starting point. What we’ll look at here are the Mexican micro-geographies, AGEB and Manzana. These are the two smallest levels of geography at which Mexico’s Census tabulates demographic data, and they’re the levels that matter most to demographics analysts in the business world.
Let’s look at the larger of the two geographies, the AGEB. The word AGEB is an acronym, standing for Area Geo-Estadistica Basica: In other words, the basic geo-statistical area. If you’re familiar with the U.S. Census, the closest parallel is a Block Group (not, as some claim, a Census Tract). The average population in a Mexican urban AGEB is just over 1500 individuals, which is a close comparison to the average U.S. Block Group’s 1400 individuals.
When comparing a U.S. Census Block Group to a Mexico Census AGEB, there’s one crucial difference that I can’t stress highly enough. While U.S. Census Block Groups have total territorial coverage, and every acre of land in America belongs to one, the same is not true of AGEBs. INEGI, the custodian of Mexico’s Census and geographic data, defines rural AGEBs differently from urban AGEBs; they even have a different structure for their unique identifiers. Overall, for business users, this is far from a bad thing; in fact, it’s very convenient. Mexico’s definition of a rural area is very conservative; even small farming villages are most often defined as “Urban” by the Mexican Census.
In Mexico’s geodemographic hierarchy, the manzana falls right below the AGEB. Actually, AGEBs are made up of a collection of manzanas. (It’s worth mentioning that the word “manzana” has two meanings in Spanish; it’s both an apple, and a city block. Maybe that means a Mexican gave New York City the moniker of “The Big Apple”?) The manzana is generally equivalent to a U.S. Census Block; while a U.S. Block houses about 50 people on average, a Mexican block averages 60 individuals.
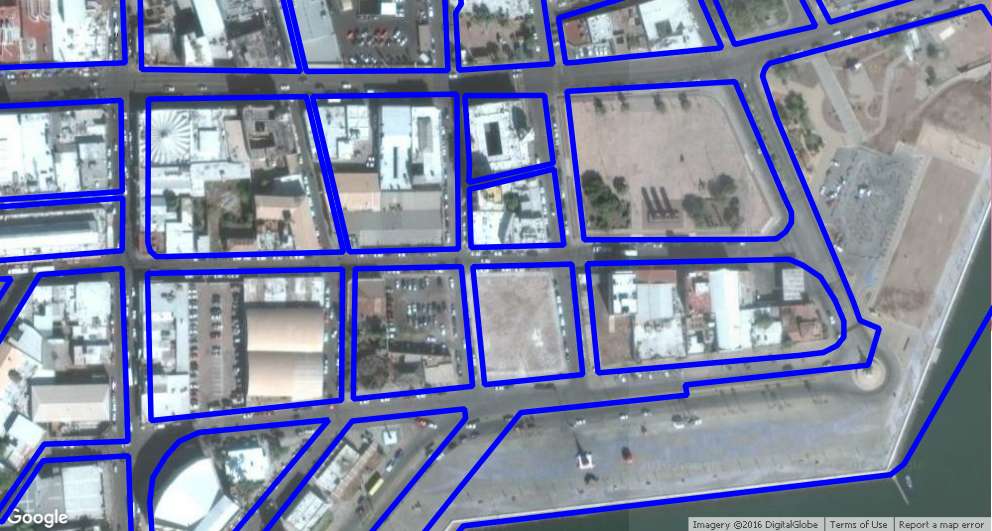
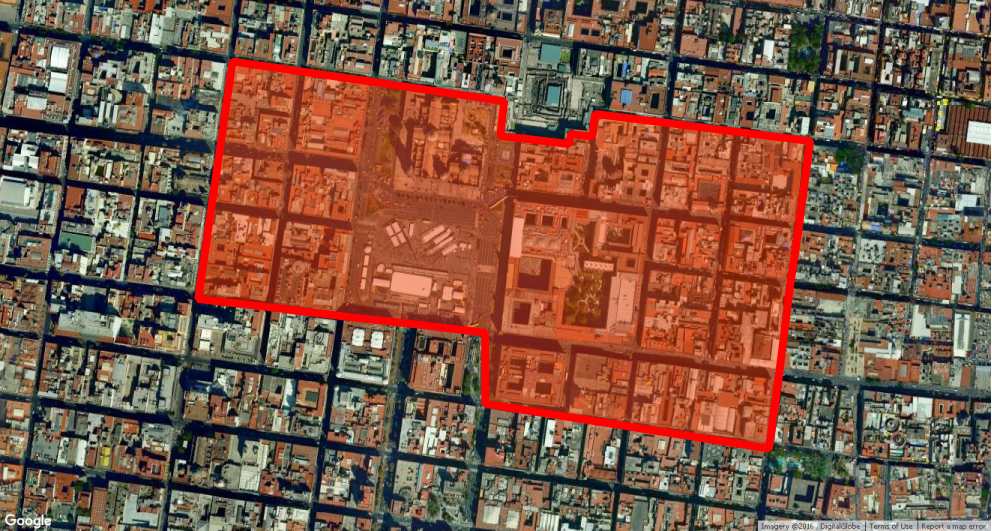
Although AGEBs are collections of manzanas, the geography looks quite a bit different. AGEBs are contiguous: neighboring AGEBs actually touch each other and share borders. Meanwhile, manzanas are not contiguous. By definition, manzanas are delineated as areas inside borders made up of streets, highways, pathways, and other naturally boundaries. So, a manzana truly is a city block. This is an important thing to know if you’re planning to do complex spatial operations on Mexico demographic data at the manzana level.
It’s worth mentioning that the manzana is the smallest level of Mexican demographics aggregation available to the general public. You’ll have to be a research scientist with excellent credentials to get to the real microdata (household- and individual-level short form data). Even then, the utility of the data is questionable, given the significant privacy protection provisions built into INEGI's analysis programs.
Now that you understand the AGEB and the manzana, we hope you have a good understanding of how they can empower your research to look at micro-areas. The AGEB and manzana allow you to define and measure your markets and demographics with surgical precision. If it doesn’t sound like a big deal now, just wait till you place a second location in a given municipality – how would you even begin to define each location’s demographics?
We’re the only data provider on the market that is building updated Mexico demographics datasets for GIS at these micro-levels. Frankly, we do it because it’s more fun to work with lots of data. With 56,000 urban AGEBs and 1.4 million manzanas, there’s enough micro-level data to guide smart business decisions in Mexico. Spend some time with us to learn how the AGEB and manzana can fit into your Mexico business strategy.
We're also proud to be the only data provider offering income data and expenditures estimates at these microscopic geographies. Using proprietary multi-source techniques, our data can help qualify AGEBs and Manzanas based on socioeconomic levels, and provide a quantitative basis for evaluating new markets based on household financial status. You've got to see how cool this new dataset is, so get in touch with us to learn more.
Municipalities in Mexico (or, municipios in Spanish) form the intersection point between political geography and Census geography. Municipios are civic boundaries, in the sense that each municipio hosts a popularly elected local government, headed by a 'presidente'. Municipio governments provide public services and serve as a recorder of public data, such as traffic fatalities or educational enrollment. For many businesses, demographics at the municipio level offer great comparative insight into their markets. We'll guide you through the municipality structure of Mexico, and how your business can use municipio data as part of your research process.
Despite some differences, a municipality is a lot like a U.S. county. For one thing, they have total territorial coverage: every square foot of land in Mexico falls within the jurisdiction of a municipality. For another thing, municipalities are uniquely related to states: they don’t cross state lines. They sometimes (but not always) completely contain metropolitan areas. Municipalities are similar in size and population to U.S. counties.
Similar to counties, the size and population of municipalities is not written in stone. A lot of factors, from the history of colonization to the timing of population growth on the frontiers, affect the size, shape and population of a municipality. There’s great diversity among Mexican municipios. There are large ones (averaging 5,700 square miles in Baja California Sur), and there are small ones (averaging just 25 square miles in Tlaxcala). There are states with many (Oaxaca, with 570) and states with few (the Baja Californias, with 5 apiece).
This last point is an important one. Business users who analyze a location based on the demographics of its municipality can run the risk of not comparing apples-to-apples. In Oaxaca, a municipality may be not much larger than a village. Why compare those demographics to, for example, municipalities from the Distrito Federal, one of the densest populated areas in the world?
As of writing, there are 2,457 municipios in Mexico. That number is subject to change, based on a periodic realignment of political boundaries. The newest Municipio, called Bacalar in the state of Quintana Roo, is just a couple of years old.
Using a municipio as a unit of geography for business research in Mexico makes sense for a lot of organizations. Retailers and CPG companies who are strategizing a market entry would be ideal candidates; a demographic dataset at this level would help them determine which areas of the country are best suited for the “first wave”. For other organizations, it makes sense. Businesses with an extensive footprint in Mexico, who are pursuing fill-in growth and making rooftop-level decisions, would be better served by demographics at an AGEB or Manzana level.
But, even for power users, there’s a compelling case for why municipios should be part of your research process. It revolves around the scale and scope of data available at this geographic level. Things like vehicle registration, mortality statistics, agricultural production figures, and many other niche datasets are only compiled down to the municipio level. The best part is that, more often than not, these data are tabulated annually, meaning you have a fresh dataset off of which to base important decisions.
Overall, a municipio is a great geographic unit for business analysis, with some tradeoffs. Municipios aren’t the best for trade area delineation or sales forecasting, but they are a great way to get a handle on macro-market analytics. We develop extensive demographics datasets at the municipio level, and we offer custom datasets that bring in some of the more obscure variables. There’s a lot of value to be had for Mexico researchers with municipality data. Keep exploring geoanalitica.com to learn more about what can be done.
As is the case with most national Census programs, Mexico's Census is designed for a civic purpose, rather than for business applications. The demographics that are collected through the Mexican Census tend to deal with factors that affect the way the government serves its population. While core variables like household and population count, age, and education level have a direct application in market research, these don't paint the whole picture of Mexican demographic characteristics. We're going to walk you through the strengths and weaknesses of the Mexican Census, as it relates to population and household demographics for business research.
The Mexican census is a decennial enumeration, conducted in years ending in 0. The logistics of the Census are managed by INEGI, the national institute for geography and statistics. Mexico’s census, like its northern neighbor’s, was designed to guide political representation and taxation. Though it was not intended to be used for business research, it just so happens that much of the data collected in the census has a tremendous value for the private sector.
It’s worth noting that that INEGI also conducts a mid-cycle “conteo”; essentially, a light version of the Census. A similar questionnaire is used, and the Conteo is conducted with a goal sampling the population in a way that represents of 100% population coverage. You can learn more about the 2015 Conteo, in plain English, through our blog post on that program.
INEGI’s geographic hierarchy is unique, but very rational. Nationwide, the INEGI Censo 2010 covers geographies like Entidad Federal (basically, states) and municipio (a unit comparable in size and function to a U.S. county). Every square meter of Mexican territory belongs to one of these units. On the other hand, there are some very micro-level urban geography units. Most notably, these include the urban localidad, as well as the AGEB (smaller than a localidad) and the manzana (even smaller than the AGEB). These urban units are ‘nested’ in a way where each geography’s unique code indicates which ‘parents’ it belongs to in the hierarchy.
If you’re familiar with U.S. demographic datasets, you’ll have to change your expectations in Mexico. The U.S. Bureau of the Census makes use of the American Community Survey (ACS), a nationwide household survey that covers about 2.4% of the population each year. It has a long laundry list of available variables, and while the data isn’t always conceptually small for small-level spatial analysis, it at least provides a number. Most, but not all, commercially-developed demographics for the U.S. are based on the ACS. The Mexican Census uses the mid-Census Conteo, as well as a number of specialized household surveys, to fill in the gaps. It’s not necessarily a better or worse way of getting mid-cycle data; it’s just different.
Because the census is a civic undertaking, rather than a commercial one, some census data are irrelevant to commercial researchers. Literacy rates, healthcare access, and indigenous language use are examples of data points that help the Mexican government better direct its investment in social services and infrastructure, but don’t have a clear relationship to the population’s consumption patterns.
Similarly, a lot of the data we would hope to see in a census enumeration is notably absent. INEGI does not tabulate household income figures as part of the census. It also does not tabulate consumer expenditures. These data, and others, are available through other programs and surveys. At GeoAnalitica, we do quite a bit of work linking these disparate data sources together in a rational way.
So, in a nutshell, the Mexican Census itself is a useful tool with some notable limitations for business users. Its data provides a solid foundation for building out derived, value-added datasets that have a commercial tilt. In our datasets, we’ve engineered out a lot of the inconsistency and limitations. We have a methodology to update demographics to current year, and we have a process to incorporate income and expenditures survey data into our estimates. For researchers in retail, CPG and other organizations, there are many more pros than cons to using Mexican Census-based data. Take a look at our products, and contact us to learn more about our unique methodologies and their advantages over pure INEGI Censo data.