We’re pleased to announce the release of our newest vintage of Mexico geodemographic data. GeoAnalitica’s 2019 Mexico data products offer growth-adjusted estimates for a few hundred variables (among them, 2019 population, 2019 household count, and 2019 household income). Our 2019 Mexico estimates are available at the most relevant geographic units: a package of Urban AGEBs, Rural AGEBs, and Growth Grids that offer 100% territorial coverage in high-definition.
We’re particularly excited because this vintage of data is possibly the final vintage based on Censo 2010 AGEBs and base-year data. Mexico Censo 2010 has never been more outdated than it is right now, and we cringe to even imagine companies using straight-out-of-Censo 2010 results to make decisions right now in 2020. Meanwhile, Mexico’s Censo 2020 is currently in progress, and there’s a possibility its tabulations and cartography will be published in time to guide GeoAnalitica’s next vintage of 2020 Mexico population and demographic estimates. (Though, keep in mind, by the time Censo 2020 is published – even in the absence of any COVID-related slowdowns – it’s already 8-12 months out of date, due to the enormous need for lead-time when delineating geographies and conducting in-person follow-up interviews).
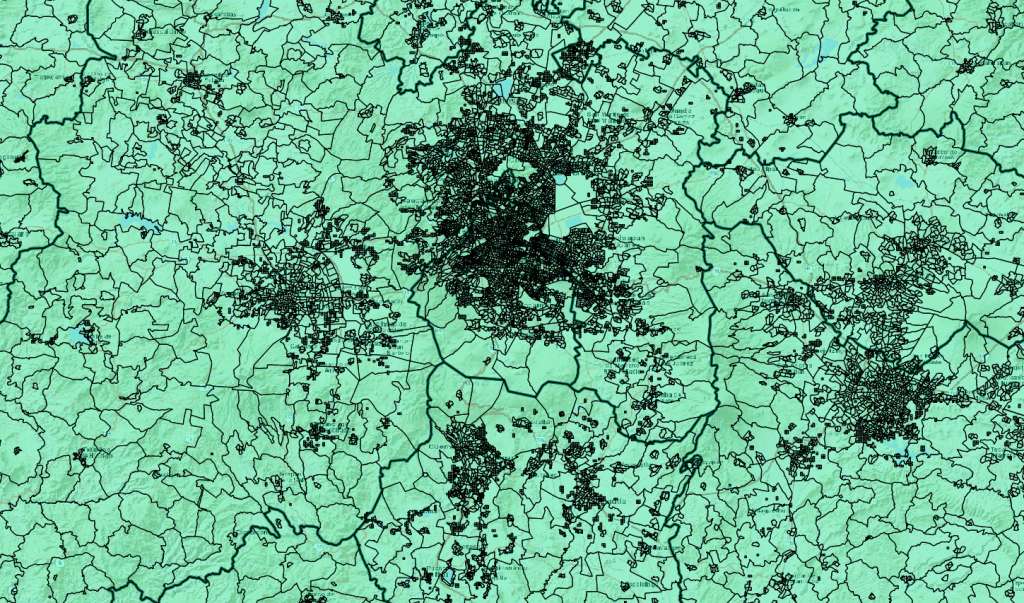
It’s always more fun to put our new vintages in perspective with numbers. Our 2019 dataset covers 90,989 geographic units (split among Urban AGEBs, Rural AGEBs, and our proprietary Growth Grids, which identify pockets of urban-type population outside of traditional Urban AGEBs). In those nearly 91,000 geographic units, we estimate Mexico’s population in 2019 at 127,147,385 people. We are also estimating Mexico household count in 2019 of 32,560,630. And, to top it all off, we estimate a 2019 Mexico average household income of MXN$221,000. We also classify AGEBs and Growth Grids according to their most likely predominant social class, so we’re able to estimate households falling in class A/B, C+, C, C-, D+, D and E (get in touch with us through our contact form if you’re curious about those numbers.) There are a few hundred other variables that we estimate, but these are the ones we’re most frequently asked about.
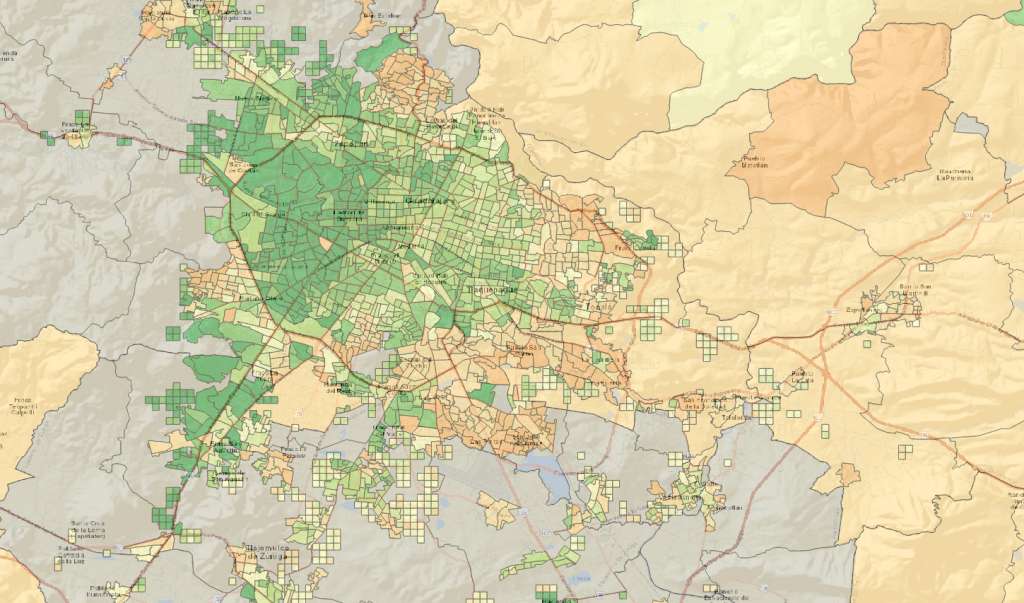
Remember, these are national figures, and we’ll go out on a limb and tell you the uncomfortable truth: unless you’re in a business with absolutely zero geographic footprint, it kind of doesn’t matter what the national numbers look like. It’s much better to have a reliable, ground-level estimates so you can understand market-level realities and changes over time. Things like, which part of the Guadalajara metro area has the highest concentration of high socioeconomic class? Which cities in the Bajío are experiencing the strongest population growth, and what corner of the city is it the strongest? Whether you’re in the business of site selection for retail outlets in Mexico, logistics planning, or anything else that has a geographic footprint at its core, you should see what our data has to say. Reach out to us if you’d like to dig in deeper to GeoAnalitica’s Mexico 2019 demographics.
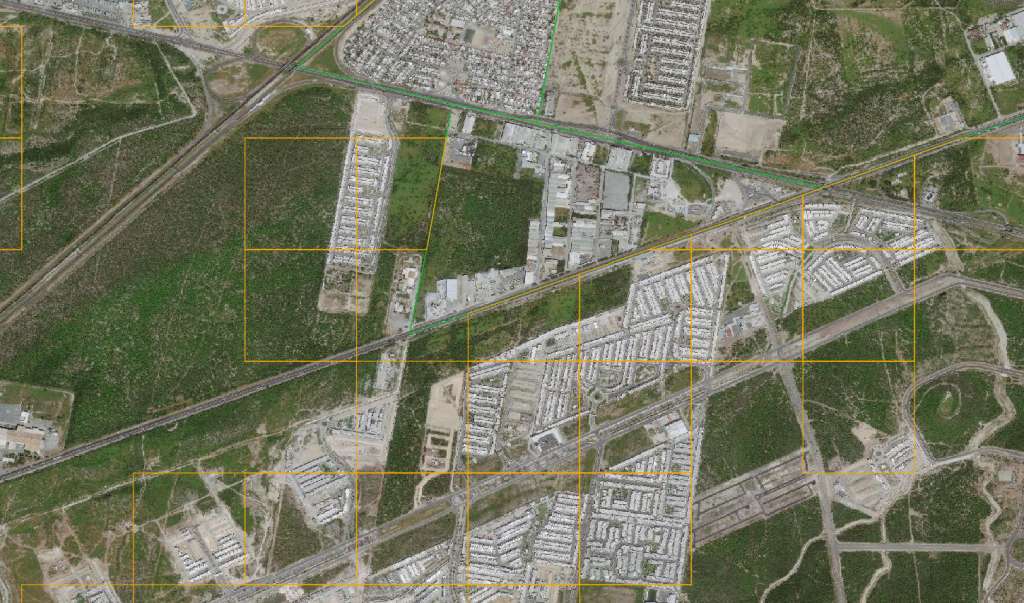
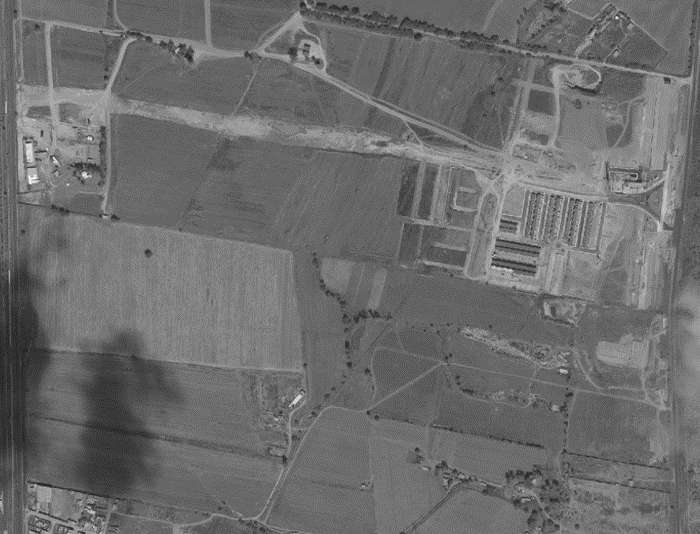
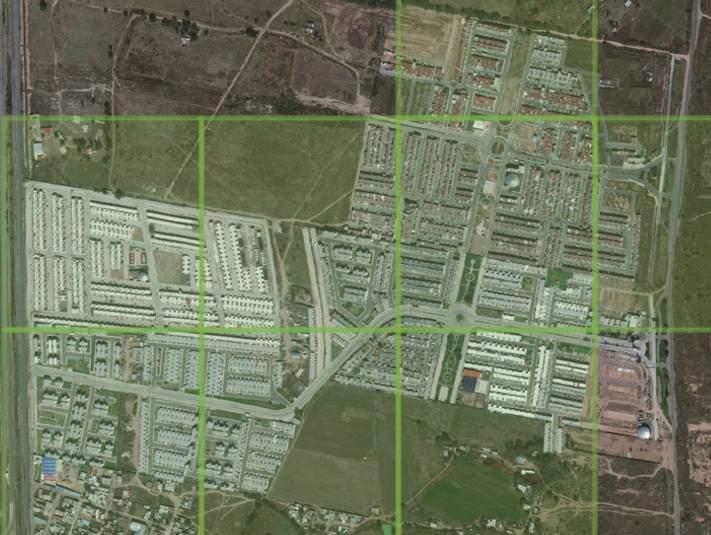
On the south side of Aguascalientes city, tucked behind the gargantuan Nissan factory, sits an expansive new residential development geared towards the working class. Viñedos del Sur is a densely packed community, townhouse-style, with minimal amenities and scarcely even a tree. Yet despite this agglomeration of household (we estimate nearly 3,200), nobody who lives here shows up in INEGI data, though coincidentally, this neighborhood is just a 15 minute drive from INEGI’s national headquarters. That’s not to say it’s INEGI’s fault – they are not in the business of annual population estimates, and this neighborhood was bare dirt the last time a Censo was conducted in 2010.
Because INEGI is not set up for estimating the size and location of current-year population, at a micro-level, a different approach is required. GeoAnalitica’s solution to the problem of “invisible neighborhoods” relies on multiple change-aware sources that help us measure population changes at large levels (like, a municipio), and allocate those changes to the micro-areas in the community that have given evidence of population change. Sometimes that happens inside an AGEB, but sometimes there’s not even a shape on the map to reference. Viñedos del Sur, like so many other brand-new communities, gets assigned to one of GeoAnalitica’s 15,000+ Growth Grids, so that they can finally show up on trade area maps.
Adjusted Censo-type data gives a good estimate of people’s base demographics for the current year. But something more is needed to summarize their consumer potential and socioeconomic level. By tying in even more independent data sources, GeoAnalitica provides estimates that no other source can match, and at a micro-level. For example, in Viñedos del Sur and its neighboring communities, we’re seeing a predominant socioeconomic level of D and D+. Browse through some of our 360 degree streetviews from June of 2019, and we think you’ll agree.
Since Censo 2010, literally hundreds of thousands of young, growing families have set up homes in brand-new communities like this one. These families are the future of consumption in Mexico, and it would be tragic for marketers and retail operators and strategists to not know where and how many they are. Stay tuned to this blog for more examples, and reach out to us with questions about the growth areas in Mexico that you’re most interested in.