We’re pleased to announce the release of our newest vintage of Mexico geodemographic data. GeoAnalitica’s 2019 Mexico data products offer growth-adjusted estimates for a few hundred variables (among them, 2019 population, 2019 household count, and 2019 household income). Our 2019 Mexico estimates are available at the most relevant geographic units: a package of Urban AGEBs, Rural AGEBs, and Growth Grids that offer 100% territorial coverage in high-definition.
We’re particularly excited because this vintage of data is possibly the final vintage based on Censo 2010 AGEBs and base-year data. Mexico Censo 2010 has never been more outdated than it is right now, and we cringe to even imagine companies using straight-out-of-Censo 2010 results to make decisions right now in 2020. Meanwhile, Mexico’s Censo 2020 is currently in progress, and there’s a possibility its tabulations and cartography will be published in time to guide GeoAnalitica’s next vintage of 2020 Mexico population and demographic estimates. (Though, keep in mind, by the time Censo 2020 is published – even in the absence of any COVID-related slowdowns – it’s already 8-12 months out of date, due to the enormous need for lead-time when delineating geographies and conducting in-person follow-up interviews).
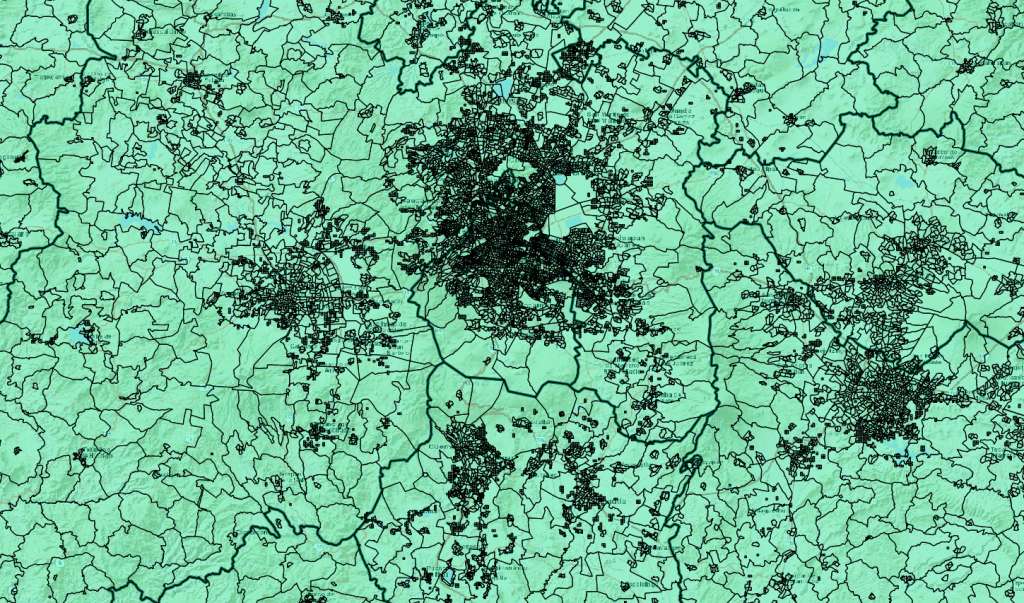
It’s always more fun to put our new vintages in perspective with numbers. Our 2019 dataset covers 90,989 geographic units (split among Urban AGEBs, Rural AGEBs, and our proprietary Growth Grids, which identify pockets of urban-type population outside of traditional Urban AGEBs). In those nearly 91,000 geographic units, we estimate Mexico’s population in 2019 at 127,147,385 people. We are also estimating Mexico household count in 2019 of 32,560,630. And, to top it all off, we estimate a 2019 Mexico average household income of MXN$221,000. We also classify AGEBs and Growth Grids according to their most likely predominant social class, so we’re able to estimate households falling in class A/B, C+, C, C-, D+, D and E (get in touch with us through our contact form if you’re curious about those numbers.) There are a few hundred other variables that we estimate, but these are the ones we’re most frequently asked about.
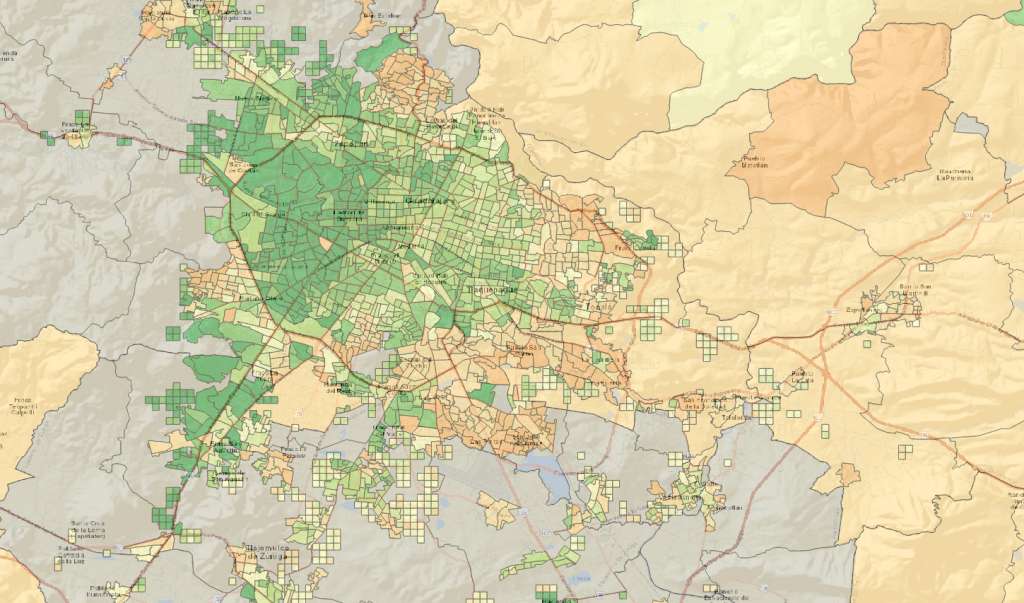
Remember, these are national figures, and we’ll go out on a limb and tell you the uncomfortable truth: unless you’re in a business with absolutely zero geographic footprint, it kind of doesn’t matter what the national numbers look like. It’s much better to have a reliable, ground-level estimates so you can understand market-level realities and changes over time. Things like, which part of the Guadalajara metro area has the highest concentration of high socioeconomic class? Which cities in the Bajío are experiencing the strongest population growth, and what corner of the city is it the strongest? Whether you’re in the business of site selection for retail outlets in Mexico, logistics planning, or anything else that has a geographic footprint at its core, you should see what our data has to say. Reach out to us if you’d like to dig in deeper to GeoAnalitica’s Mexico 2019 demographics.
Cada año, GeoAnalitica hace un recorrido de un área de Mexico, para sacar fotos de las comunidades representadas por nuestras Cuadras de Crecimiento. Lo hacemos para poder mostrar en nuestra mercadotecnia cómo se ven las Cuadras en la vida cotidiana. También intentamos reforzar el idea: sin los datos demográficos de las Cuadras (que no se cubren por el Censo), las empresas mexicanas no sabrían ni el dónde ni el cuánto de los consumidores que viven en áreas recién construidas.
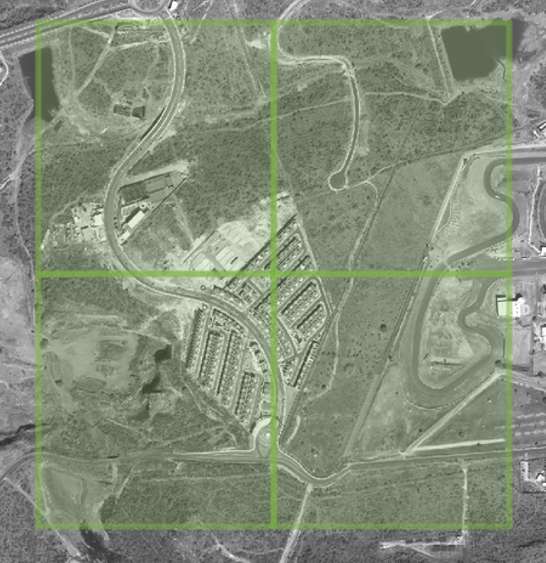
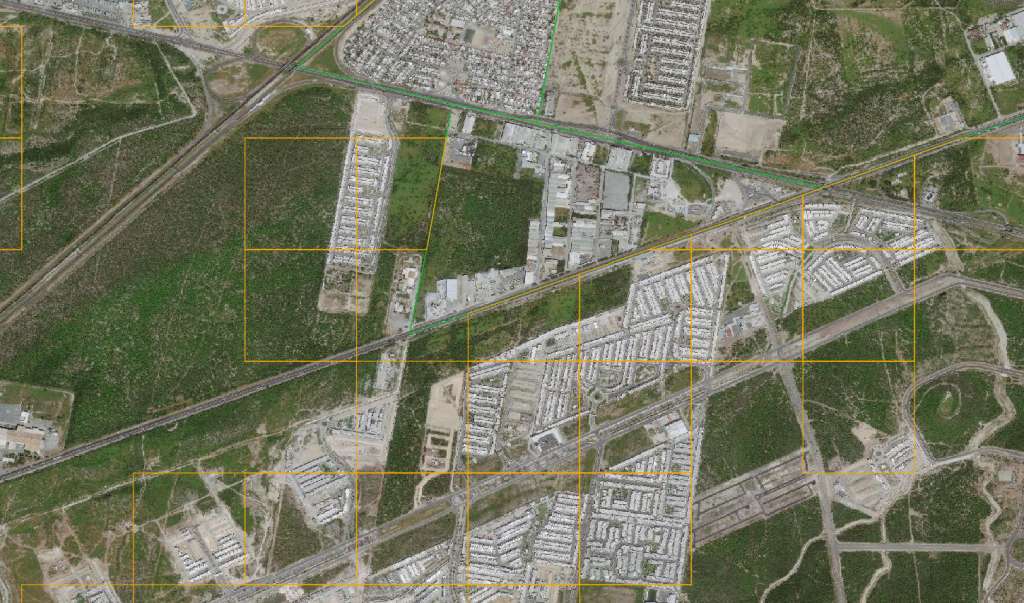
El verano pasado, fuimos al Bajío, un área que ha experimentado mucho crecimiento residencial, un resultado del fuerte crecimiento industrial que ha aumentado y mejorado la economía de la región. En este blog, vamos a enfocarnos en el sureste de la ciudad de Querétaro. Residencial del Parque es una comunidad compuesta de varias etapas de desarrollo, que se construyeron uno tras uno desde 2012. No hay que decir que esta área no fue censada, ni tampoco fue incorporada dentro de ningún AGEB, porque el Censo fue solo un snapshot del año 2010.
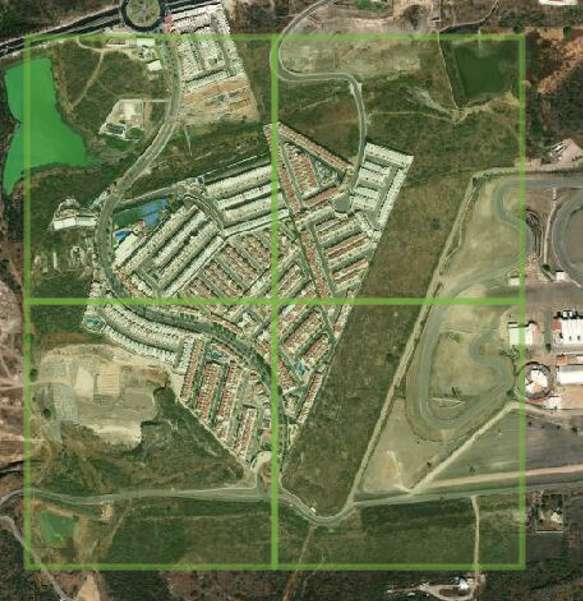
Aunque no aparezca en ninguna otra fuente de datos demográficos, Residencial del Parque sí existe, sí crece, y sí es un núcleo de consumidores de clase media. GeoAnalitica estima que en los 4 Cuadras de Crecimiento que forman esta comunidad, existen unas 4509 personas dentro de 1346 hogares. Ellos pueden hacer la diferencia entre la decisión de ubicarse en el área y no.
Nuestra metodología estima más que el número de personas y de hogares. Hay cientos de variables, y entre ellos, lo más pedido es el Nivel Socioeconómico. Construimos este variable tomando en cuenta estimativas de la vecindad proporcionadas por el gobierno, también con índices de los valores de viviendas con respecto a promedios regionales. En Residencial del Parque, estimábamos un NSE de C y de D+, que a pesar de todo que vimos, parece un poco bajo. Las casas, la vigilancia, los carros del año, todo representa una clase de C y más alta. (Ésta es otra propuesta de nuestros recorridos: identificar áreas geográficas en cuales nuestra metodología tiene fracasos, para poder afinarla en el año que viene.)
Después de nuestros recorridos, publicamos las fotos en Mapillary, una plataforma abierta que nos permite compartir los Streetviews (y, también, nuestras fotos les ayudan a la comunidad OSM mejorar sus mapas en estas áreas tan nuevas). Así, puedes ver lo que vimos en Residencial del Parque, como si estuvieras allí en vivo. Pasa un par de minutos observando las fotos, y pregúntate: ¿cómo se mejoraría nuestro proceso de selección inmobiliaria si tomara en cuenta el crecimiento que se nota en esta Cuadra de GeoAnalitica?