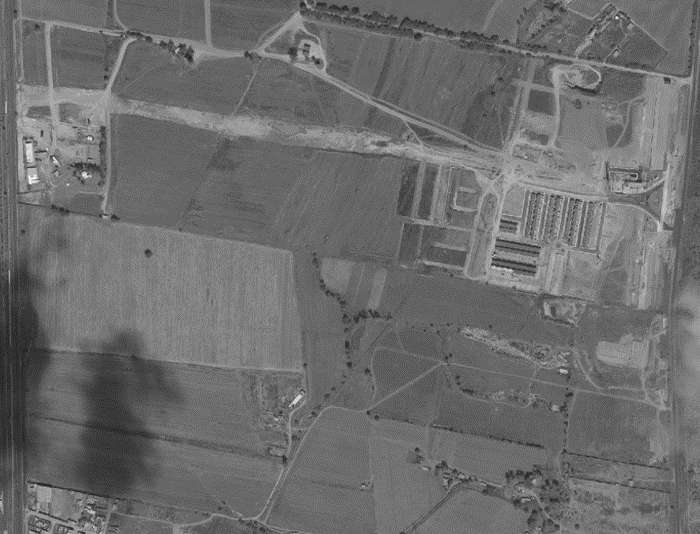
On the south side of Aguascalientes city, tucked behind the gargantuan Nissan factory, sits an expansive new residential development geared towards the working class. Viñedos del Sur is a densely packed community, townhouse-style, with minimal amenities and scarcely even a tree. Yet despite this agglomeration of household (we estimate nearly 3,200), nobody who lives here shows up in INEGI data, though coincidentally, this neighborhood is just a 15 minute drive from INEGI’s national headquarters. That’s not to say it’s INEGI’s fault – they are not in the business of annual population estimates, and this neighborhood was bare dirt the last time a Censo was conducted in 2010.
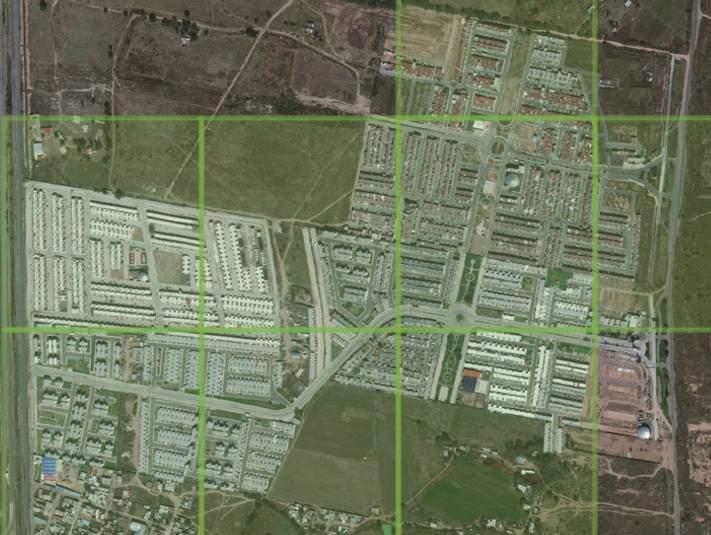
Because INEGI is not set up for estimating the size and location of current-year population, at a micro-level, a different approach is required. GeoAnalitica’s solution to the problem of “invisible neighborhoods” relies on multiple change-aware sources that help us measure population changes at large levels (like, a municipio), and allocate those changes to the micro-areas in the community that have given evidence of population change. Sometimes that happens inside an AGEB, but sometimes there’s not even a shape on the map to reference. Viñedos del Sur, like so many other brand-new communities, gets assigned to one of GeoAnalitica’s 15,000+ Growth Grids, so that they can finally show up on trade area maps.
Adjusted Censo-type data gives a good estimate of people’s base demographics for the current year. But something more is needed to summarize their consumer potential and socioeconomic level. By tying in even more independent data sources, GeoAnalitica provides estimates that no other source can match, and at a micro-level. For example, in Viñedos del Sur and its neighboring communities, we’re seeing a predominant socioeconomic level of D and D+. Browse through some of our 360 degree streetviews from June of 2019, and we think you’ll agree.
Since Censo 2010, literally hundreds of thousands of young, growing families have set up homes in brand-new communities like this one. These families are the future of consumption in Mexico, and it would be tragic for marketers and retail operators and strategists to not know where and how many they are. Stay tuned to this blog for more examples, and reach out to us with questions about the growth areas in Mexico that you’re most interested in.