We’re pleased to announce the release of our newest vintage of Mexico geodemographic data. GeoAnalitica’s 2019 Mexico data products offer growth-adjusted estimates for a few hundred variables (among them, 2019 population, 2019 household count, and 2019 household income). Our 2019 Mexico estimates are available at the most relevant geographic units: a package of Urban AGEBs, Rural AGEBs, and Growth Grids that offer 100% territorial coverage in high-definition.

We’re particularly excited because this vintage of data is possibly the final vintage based on Censo 2010 AGEBs and base-year data. Mexico Censo 2010 has never been more outdated than it is right now, and we cringe to even imagine companies using straight-out-of-Censo 2010 results to make decisions right now in 2020. Meanwhile, Mexico’s Censo 2020 is currently in progress, and there’s a possibility its tabulations and cartography will be published in time to guide GeoAnalitica’s next vintage of 2020 Mexico population and demographic estimates. (Though, keep in mind, by the time Censo 2020 is published – even in the absence of any COVID-related slowdowns – it’s already 8-12 months out of date, due to the enormous need for lead-time when delineating geographies and conducting in-person follow-up interviews).
It’s always more fun to put our new vintages in perspective with numbers. Our 2019 dataset covers 90,989 geographic units (split among Urban AGEBs, Rural AGEBs, and our proprietary Growth Grids, which identify pockets of urban-type population outside of traditional Urban AGEBs). In those nearly 91,000 geographic units, we estimate Mexico’s population in 2019 at 127,147,385 people. We are also estimating Mexico household count in 2019 of 32,560,630. And, to top it all off, we estimate a 2019 Mexico average household income of MXN$221,000. We also classify AGEBs and Growth Grids according to their most likely predominant social class, so we’re able to estimate households falling in class A/B, C+, C, C-, D+, D and E (get in touch with us through our contact form if you’re curious about those numbers.) There are a few hundred other variables that we estimate, but these are the ones we’re most frequently asked about.
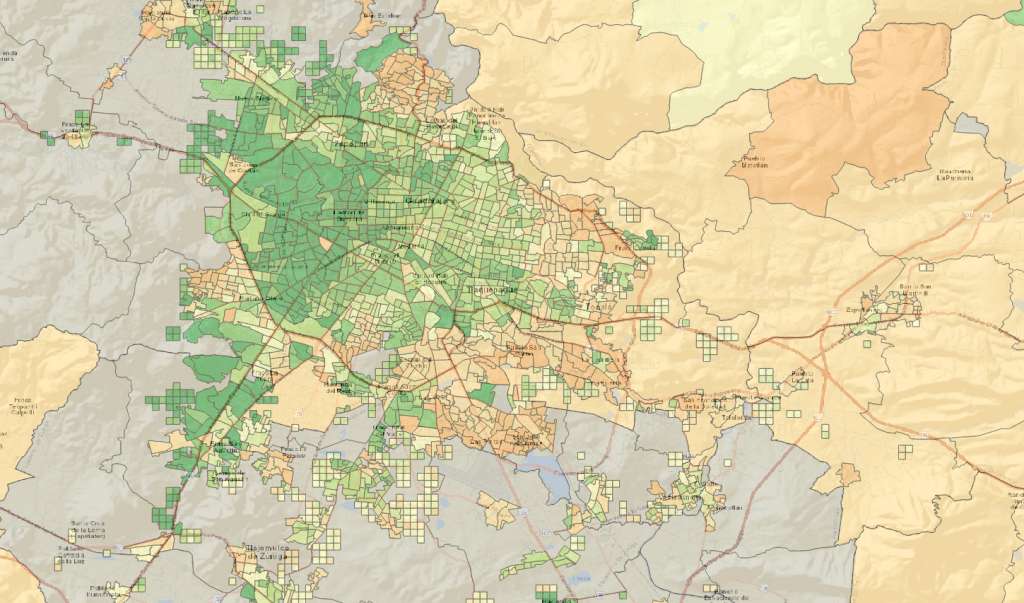
Remember, these are national figures, and we’ll go out on a limb and tell you the uncomfortable truth: unless you’re in a business with absolutely zero geographic footprint, it kind of doesn’t matter what the national numbers look like. It’s much better to have a reliable, ground-level estimates so you can understand market-level realities and changes over time. Things like, which part of the Guadalajara metro area has the highest concentration of high socioeconomic class? Which cities in the Bajío are experiencing the strongest population growth, and what corner of the city is it the strongest? Whether you’re in the business of site selection for retail outlets in Mexico, logistics planning, or anything else that has a geographic footprint at its core, you should see what our data has to say. Reach out to us if you’d like to dig in deeper to GeoAnalitica’s Mexico 2019 demographics.
San Luis Potosí is riding the same wave as so many of its neighbors. Good quality of life, a stable security situation, and a central location coupled with great infrastructure make for a booming local economy. The expansion of middle-class jobs in SLP has created a significant demand for new housing, and true to form, developers are building to meet those needs with high-density single-family homes.
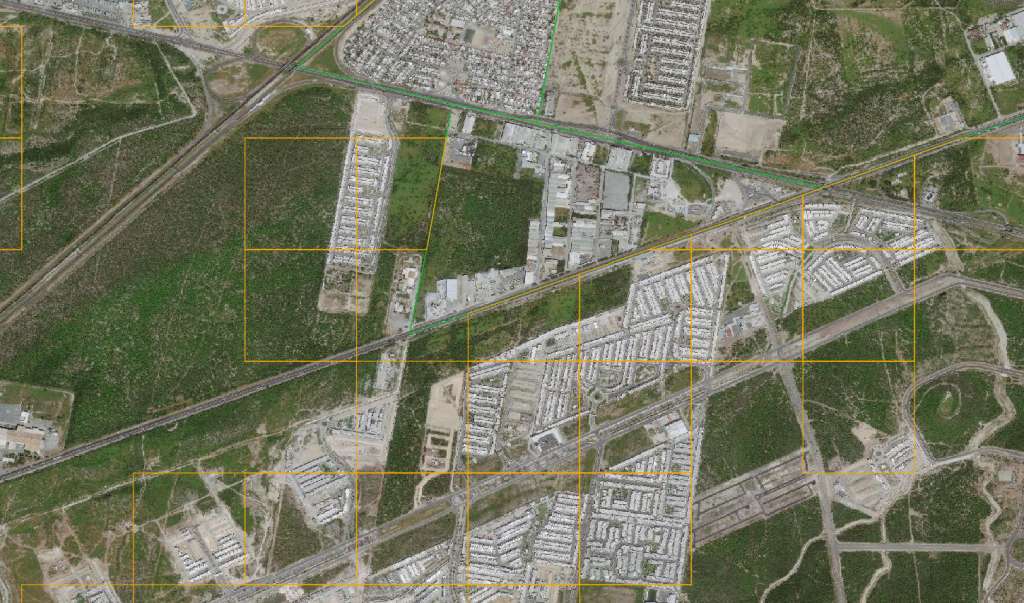
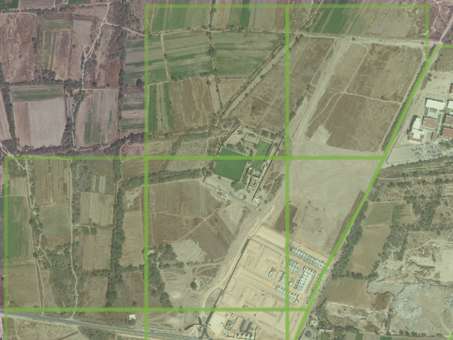
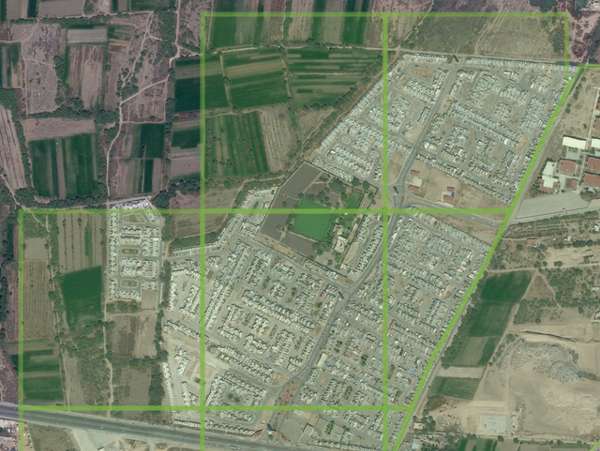
Today, we’ll take a look at Residencial Puerta Real, on the northern edge of SLP. It is quite literally “on the other side of the periférico”, situated along the urban ring-road in a way that allows its residents easy commuting to industrial outgrowth to the south and business centers downtown. Puerta Real has been growing piecemeal, with initial phases starting just after Censo 2010, and new phases that -- even to this day – are being completed and sold to SLP’s burgeoning middle class. (You can take a look at GeoAnalitica’s embedded Mapillary streetviews below, which we shot during our 2019 research trip to the Bajío region.)
Like so many other recent growth stories, you won’t find Residencial Puerta Real in any INEGI dataset. How could it be, when it didn’t exist the last time data were collected? Censo 2010 geography teams delineate boundaries (Manzanas, AGEBes and others) about a year before a given census, which means that if a development was not constructed by 2009, it was pretty unlikely to have an AGEB delineated around it. And, where there’s no AGEB boundary, there simply can’t be any Censo 2010 data to fill it up.
That’s why we developed our own boundaries called Growth Grids, and methodologies to “fill them up” with demographic estimates. (Readers who have been keeping up with GeoAnalitica can probably recite that whole line of logic by heart.) This gives the analysts who need it the most – i.e., corporate site selection specialists – the data they need to rationalize a trade area and to evaluate its economics. And it doesn’t take many Growth Grids to make a material impact on a trade area’s numbers.

Take Puerta Real, for example. It went from non-existent at the time of Censo 2010, to a 2018 estimate of 1,589 households and 7,426 people. That’s no small impact, especially considering this is a predominantly C-class area with a smattering of A/B – groups that many consumer-facing brands find a profitable core demographic. (If you take a look at the embedded marketing materials and details from Puerta Real’s developer, you’ll see evidence of these social classes through the size, configuration and finishes of these new homes.)

If 7,000 “new” people sounds like a big deal to you, let us be the first to say, it’s not. Well, it’s not nearly as big of a deal as 121,275 people, which are the “new” residents detected just within our Growth Grids, and just within the SLP metro area. That’s a big deal. And San Luis Potosí is just one of dozens of growing medium-to-large cities across Mexico, places that once might have been an afterthought for multinational retailers but that have become respectable multi-unit markets in their own right.