We are pleased to announce the launch of GeoAnalitica’s 2020-vintage Mexico Demographic Data suite, the latest in our series of annually updated Mexico demographics, and the first to use INEGI’s Censo 2020 base-year data and boundaries. One hallmark of our demographics is their ability to reflect household and population growth, at the smallest area of detection, with a lag time of 12 months or less. Even though our 2020 demographic estimates reference the same calendar year as the Censo, we continue to find new growth to the tune of nearly a quarter million households, underscoring the rapid change of pace and highlighting the capabilities of our change-aware platform. But before diving into that, let's review a bit about the exciting results coming out of INEGI's Censo de Población y Vivienda 2020, a very robust data collection program that serves as the launchpad for our own annually-updated, growth-detecting Mexico demographic data.
While the core growth-detection methodology underpinning the 2020-vintage Mexico data is fundamentally unchanged, there are several exciting new changes that we’re rolling out in the 2020-vintage, to grow and evolve with Censo 2020 and other INEGI programs. But first, it makes sense to describe the relationship between Censo 2020 and our demographic data suite.
GeoAnalitica data, like most demographics packages, starts with “base-year” data. These are data that come from a reliable source, like a government statistics office, that are collected natively at the finest granularity. For programs like censuses, these data are collected by individual interviews, typically with the head of household. The scale, scope, and sampling rate of data collection from the government agencies in charge simply can’t be matched by a private industry. To give you some perspective, INEGI employed nearly 150,000 interviewers to conduct Censo 2020 over just a couple of months in early 2020.

While the granularity and sample size are amazing, business users of census-type data have one major unmet need: updating. Mexico’s Censo programs are conducted on a ten-year interval, with no reliable updates in the meantime. This is a huge issue for any business trying to assess their markets (and potential new sites) the way they are on the ground today, including any growth or change that has evolved locally since the latest Censo count. Censo 2020, like most census programs, is designed for political and social purposes, with suitability for business analysis being kind of a fringe benefit rather than an objective.

In most other developed countries, private demographics organizations step in to fill the gaps left since the latest census count. Using a number of methodologies, each with pros and cons, these firms market their ability to provide annual updates and estimates of demographics, generally using their local census boundaries and the most recent census demographic questionnaires/results as their base-year data. In the U.S., we count at least five firms doing this work on U.S. Census demographics scales.
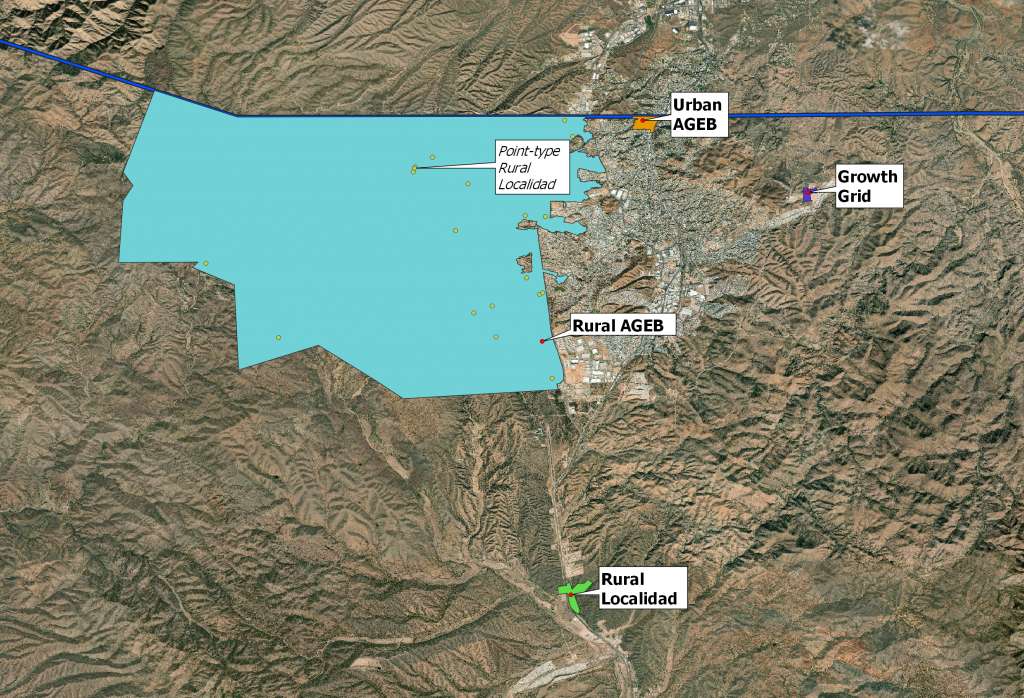
In Mexico, however, the market is much less developed. Apart from our estimates, it seems like most products are built using SWAG-style, rough estimations at low-granularity levels (perhaps Municipio). We’re fortunate to have built an allocation methodology that digests some very low-lag, high-sensitivity primary data that informs the size, scope and quality of population growth at some of the smallest Censo geostatistical units. We continue to make growth-aware estimates of Mexico demographics at AGEB for 2020 (Rural AGEB and Urban AGEB), and this year we are producing growth-detecting Mexico demographics at Localidad Rural (Rural Locality). We also re-aggregate these smaller geographies to Mexico Municipio demographic data estimates, and are capable of re-aggregating to most other standard (or custom) boundary types based on client needs.

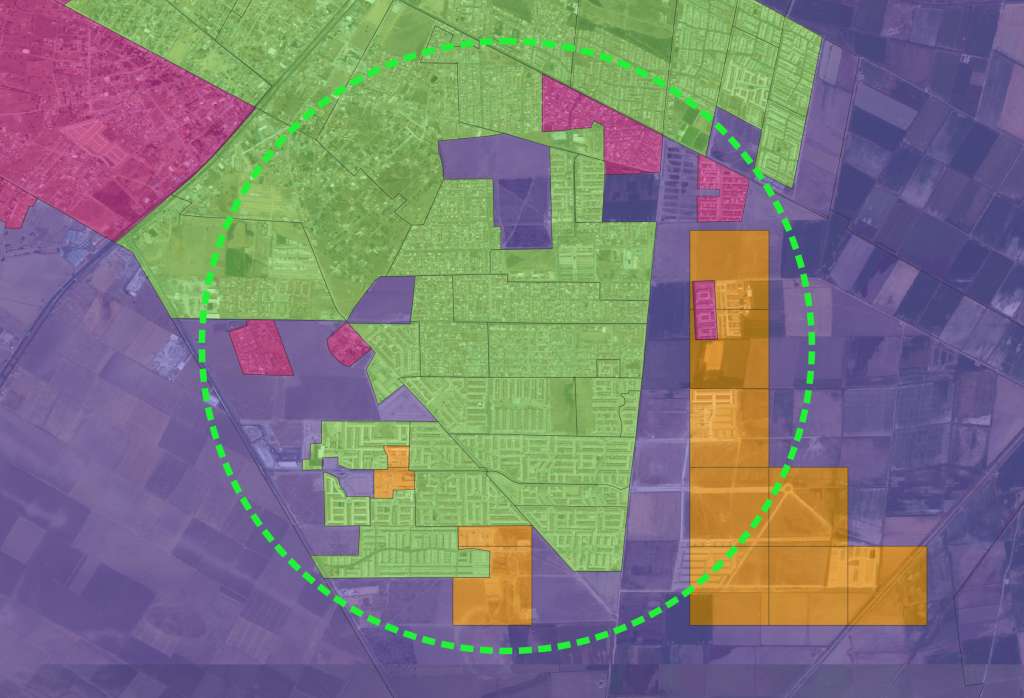
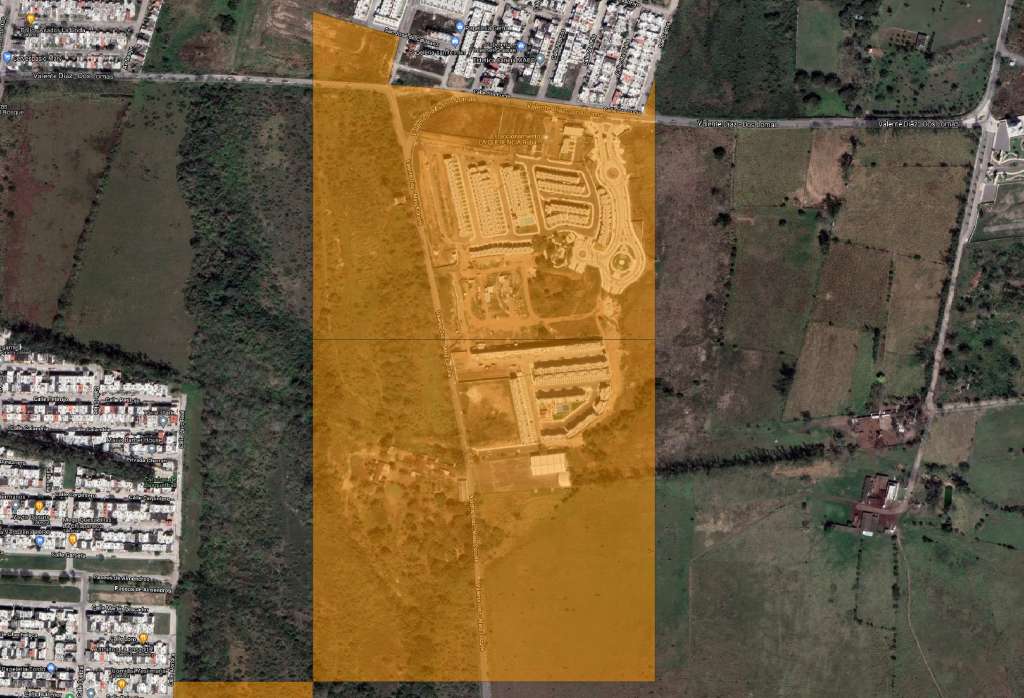
There’s one additional boundary found only in GeoAnalitica’s Mexico demographic data: our proprietary Growth Grid, which we delineate around new pockets of growth on the periphery of urbanized areas. Once we identify the new development or growth node, we slice its area out of a bounding Rural AGEB, and synthesize our estimates using intel we source on the size and socioeconomic levels of the new cluster of population. Even though the 2020-vintage demographic estimates come just months after the 100% Censo 2020 ground count, we were able to identify about 80,000 new households to include in our 2020 Growth Grids, and a further 150,000 new households associated to an existing INEGI boundary.

Censo-type demographic data is one must-have for the business analyst, but there are other necessary data that aren’t part of the Censo questionnaire. We think particularly about income, expenditures and socioeconomic classifications. While these data points are asked about in several other INEGI small-sample programs, there’s simply no source data that samples 100% of households. Be forewarned, any small-area income or socioeconomic data you see for Mexico are imputed; how they are imputed makes a huge difference. We think we have a pretty sharp methodology for making the walkacross, and we make use of several data sources and proprietary allocation techniques that give GeoAnalitica’s Mexico income data a fidelity to ground-truth that’s just not seen on most Mexico income guesstimates. We also produce Mexico socioeconomic classes (AB, C, D, etc.) for cross-compatibility with some of the external data sources most used by our client organizations.
While this blog post announces our new 2020-vintage Mexico data for demographics, income, and socioeconomic classes, there’s plenty more to come. We will be posting special highlights from our 2020 Mexico datasets here over the coming months, showing special growth stories, spotlights on specific aspects of our methodology, and plenty of interesting maps to go along with them. We encourage you to check back often, but in the meantime, we’re here to help your business with Mexico data for site selection, business analytics, and so much more.
