Anyone who pays attention to the demographics of Mexico knows that residential development can be verge on the erratic. In a medium-sized city, you may see a plot of brushy, vacant farmland transformed into a community of thousands in just a few months. Then, you might not see any new development in that city for years afterward. The on-again, off-again tendencies of large-scale residential development on the fringes of urban areas makes growth tough to keep track of, and makes a growth-aware Mexico demographic data product a must-have for consumer-facing companies that need to be on the leading edge of growth. We’re going to the medium-sized city of Poza Rica de Hidalgo, in the state of Veracruz, to look at Fraccionamiento Kaná.
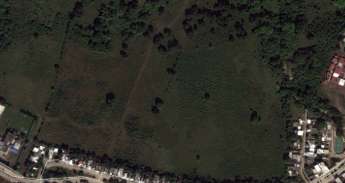
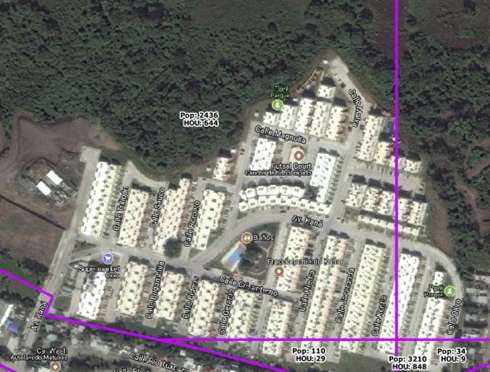
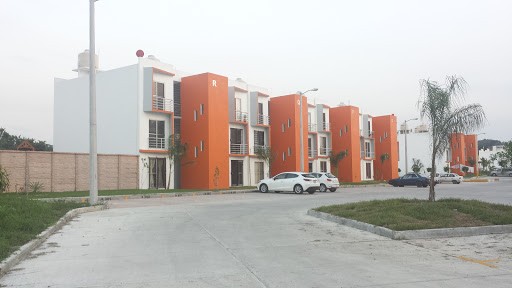
Fraccionamiento Kaná is a working-class housing development on the eastern edge of the city. Back in 2010, during the Censo, this particular piece of land was totally vacant. There wasn’t even an urban AGEB drawn to encompass it. However, development went underway sometime in 2014, eventually resulting in what we estimate to be 644 households containing 2,400 individuals. The developer's website, apart from giving us some cool photos to document what Kaná looks like, confirms that the development is 100% sold out.
Within Kaná, we see a very low household income in our data -- MXN$119K, or about 60% of the national average. We see consistency between that figure and the original pricing of the housing units in this fraccionamiento, which ranged from the mid MXN$400k range to MXN$880k. As in other parts of Mexico, we are seeing developers building stylish housing for the lower socioeconomic rungs (in this example, D+), which we believe is part of the equation to get governmental support and subsidy eligibility.
While this development itself may not make or break the case for retailers deciding whether Poza Rica is the right fit, it’s just one Growth Grid out of the 15,000+ that GeoAnalitica makes available as a demographics add-on. Our Growth Grids data tell you things about your markets that INEGI’s data cannot, because our methodology is designed from the ground up to find and measure residential growth. We think Kaná is a cool story, and a great example of the kind of development that you discover using GeoAnalitica data as part of your market research and site selection process.