
Tapachula, and Chiapas in general, doesn’t seem to get a lot of credit for the growth it has experienced. Tapachula’s fortunes are influenced by winds of change blowing northwesterly from Central America. (“Fortunes” might be a stretch…Tapachula is not quite the investment attractor that its cousins on the Northern border have always been.)
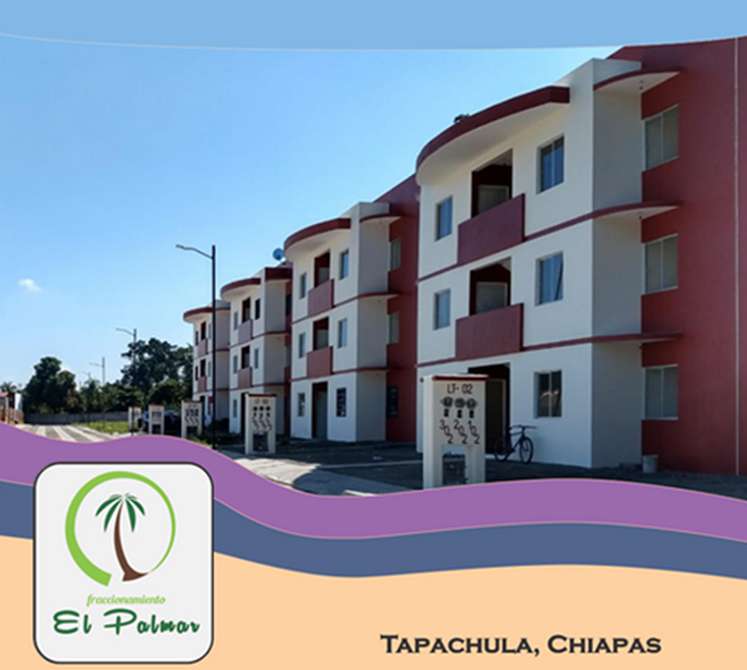
In Chiapas, master-planned formal development isn’t always the rule, so any time we can identify a new development by name, it’s interesting to take a closer look. One such development that worked its way through our Growth Grid identification process for 2018 is Fraccionamiento El Palmar, on the south side of Tapachula (where most of the city’s population growth has tended to cluster).
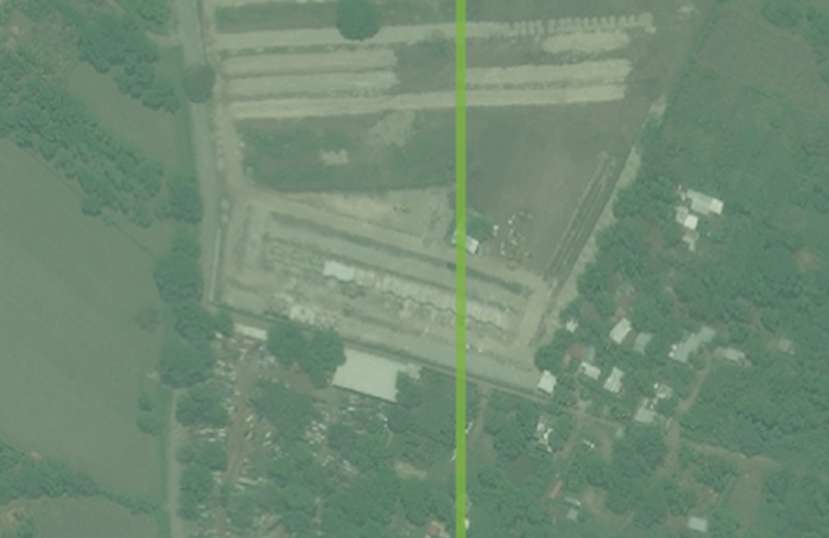
As a quick reminder, Growth Grids are boundaries that GeoAnalitica creates on its own, to encompass areas that have a residential population not covered by INEGI Censo 2010 – nor even encompassed by an INEGI boundary like AGEB or manzana.
Back to El Palmar. This is not a lux development. In fact, GeoAnalitica’s socioeconomic estimates place it at a level E, the lowest possible. Not surprising, given that a good number of the developer’s promotional photos highlight running water as an amenity, or that their marketing efforts focus on a Facebook page and a Whatsapp number. Hey, no judgment – everyone needs a place to call home and it’s great to have developers serving low-income families that have missed out on the most basic of amenities.
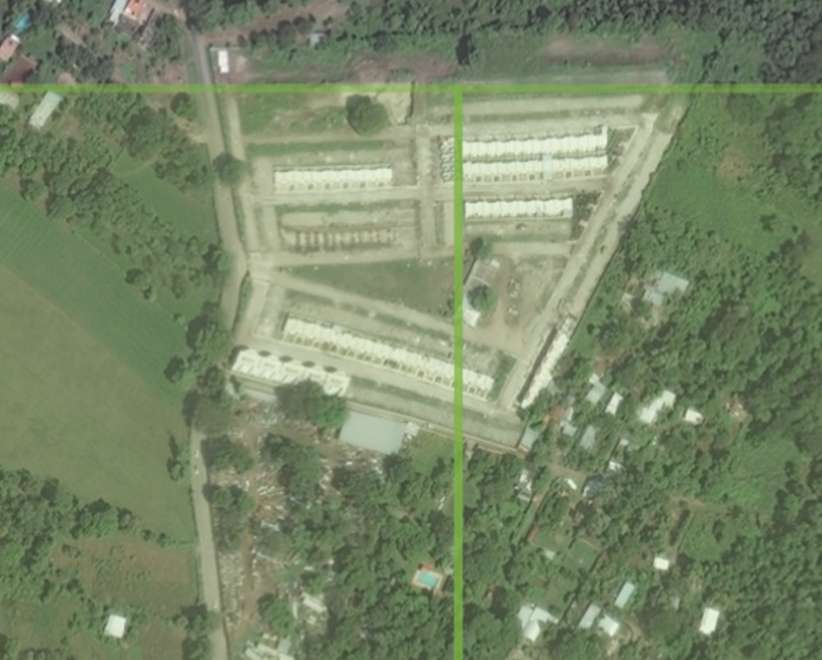
From what our research dug up, it looks like this development first started coming online back in September of 2018. It is still being marketed, which suggests that it’s working towards full occupancy.
Between the two Growth Grids it spans, we estimate 123 households for 2018. And, as mentioned, our process flagged the socioeconomic level of this area as a class E, the lowest possible score. Building permits on file with federal bureaus suggest an improbably precise 123 housing units within the development. (Out of modesty, it’s worth mentioning that our process is rarely 100% precise on household counts, so think of this as a relatively lucky guess by GeoAnalitica.)

Understand that Fraccionamiento El Palmar is relatively small for a master-planned residential development. Sure, it’s just over a hundred households, and furthermore, of a socioeconomic group that is not “big spenders”. Regardless, El Palmar illustrates an important point: new developments are being planned, built, marketed, and occupied on relatively brief timeframes. Not only is it important to have growth-aware snapshots like GeoAnalitica’s Mexico demographics to see how things have changed since Censo 2010, but it’s also important to what areas have grown even since last year. Keep checking in to our blog for similar stories in other areas.