

Part of updating our Mexico demographic data is “fact checking” the new residential growth areas that have appeared in our Growth Grids Add-on product. When we completed our 2017 demographics review, we handpicked a few of these growth stories to put in context through a blog post. Today, we’d like to take you to Pachuca, Hidalgo, to look at a growth area that’s home to more than 15,000 people not appearing in any other Mexico demographics dataset. Welcome to Los Viñedos.
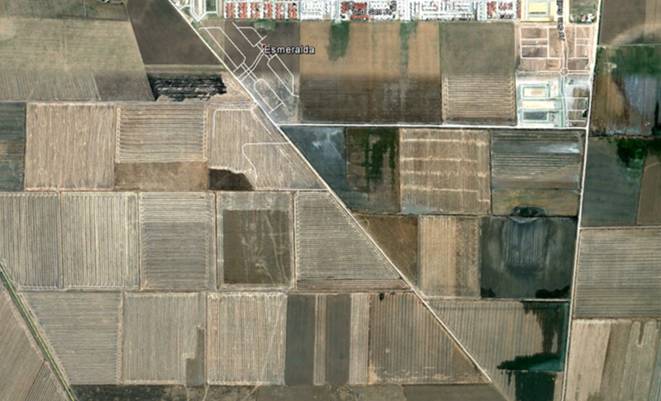
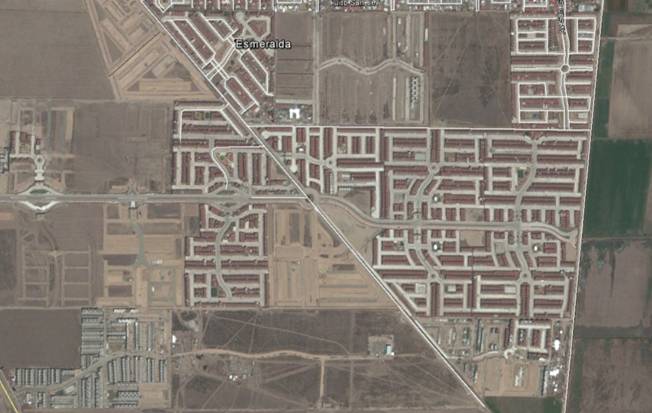
Los Viñedos is a series of developments, spearheaded by Grupo RI Comercial, with each new phase named after a different wine country or varietal. “Marsala” took root in 2013, followed the next year by “Loire” and “Chianti”. The biggest push came between 2016 and 2017, when “Abruzzo” and “Piemonte” spanned the physical gap between earlier phases with nearly a square kilometer of dense residential development. Infill continues, with “Florina” and “Orvieto” showing signs of ongoing development in the most recent remote sensing imagery we’ve seen.
The names of these phases may be fanciful, but don’t let that fool you. These developments are as real and solid as the concrete block that built them. With an estimated 4,700 households centered around these developments – none of which fall within an INEGI AGEB, and none of which had been formed at the time of Censo 2010 – Los Viñedos creates its own center of gravity for retailers serving the mid-to-lower end of the socioeconomic spectrum. (Depending on which wine varietal you look at, AMAI classes are generally D+ or C-.)
What’s interesting to us about Los Viñedos is something that’s common to so many mega-developments in Mexico: the years-long lag of retail development built in proximity to these residential developments. Besides the occasional abarrotes or neighborhood storefront, the nearest significant retailer – a Bodega outlet – is nearly a mile away in an older, established neighborhood. While the wheels are probably in motion with the majors to develop convenient formats close to this community, the fact that there’s been nothing for the first five years is a warning sign to all those using INEGI Censo 2010 results as their sole data source. INEGI’s census program measures a single point in time, once per decade. Meanwhile, GeoAnalitica’s Mexico demographics are measured once per year, without being constrained to the same old AGEB boundaries. It really does make a difference.