Recently on the GeoAnalitica blog, we’ve been digging deep into some of the thousands of growth stories taking place in our Growth Grids Add-on dataset, to show how this product helps fill in the gaps left by Mexico Censo 2010 demographics. Because Mexico AGEBs were defined by INEGI for a particular purpose, at one point in time – the compilation of Censo 2010 data during the summer of that year – they are ill-suited for looking at the way your Mexican markets look today. Our Growth Grids are proprietary boundaries that look beyond AGEBs to find growing areas, and then provide true-to-ground demographics estimates for these exciting growth areas.
Today, we’ll be zooming in on the municipality of Tecámac, in Estado de México. Straight north of Mexico City proper, Tecámac is a heavily populated municipio. Interestingly, some of the greatest growth has not been in its most populous localidad (Ojo de Agua), but rather, in some of the smaller outlying localidades. This growth story takes place near Santa María Ajoloapan.
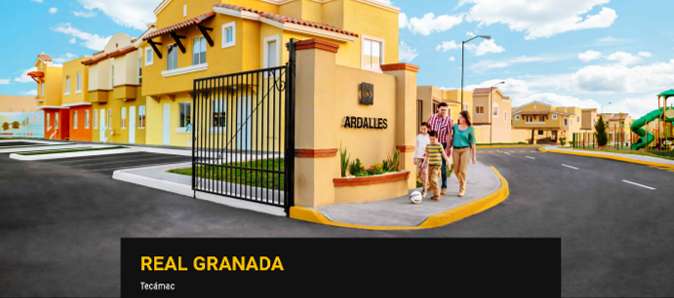
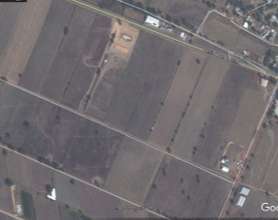
Fraccionamiento Real Granada is a sprawling new development, breaking ground in sometime in 2015, but not noticeably occupied until 2017. In that short span of time, nearly 2,500 households have been formed, home to more than 9,700 individuals. Because it was nothing but farmland in 2010, there’s not a single INEGI AGEB that touches Real Granada.
Apart from measuring the mass of people living in this new development, what can GeoAnalitica data say about their characteristics? Our process imputes demographic estimates for all of the Growth Grids that we define, ranging from age and education to income and socioeconomic class. In Fracc. Real Granada, our change-aware data sources lead us to believe this is a D/D+ neighborhood, on the lower end of middle class in Mexico.
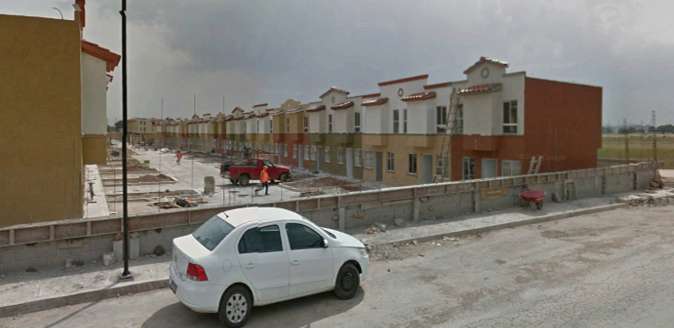
This development is so recent that even Google’s StreetView cars have not had a chance to drive it completely. A snapshot from 2017 seems to show dense, multilevel housing under development, while aerials show communal parking lots. The developer’s webpage is replete with links to the various government housing subsidies that can be applied to the MXN$500k starter home prices. GeoAnalitica’s Income and Expenditures product suggests an average household income of around MXN$186k, less than the national average.
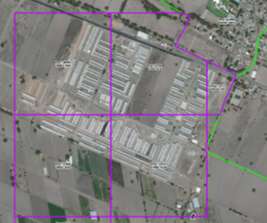
While Fracc. Real Granada has experienced booming growth in the past two years, you wouldn’t have noticed it in your Mexico census data. You might not have even seen it on a market tour, unless you had take a detour across the miles of farmland surrounding this new development. GeoAnalitica’s current year Mexico demographic data, and the Growth Grids that complete the package, offer you a way to understand the location, magnitude and context of exciting new residential developments like Real Granada.