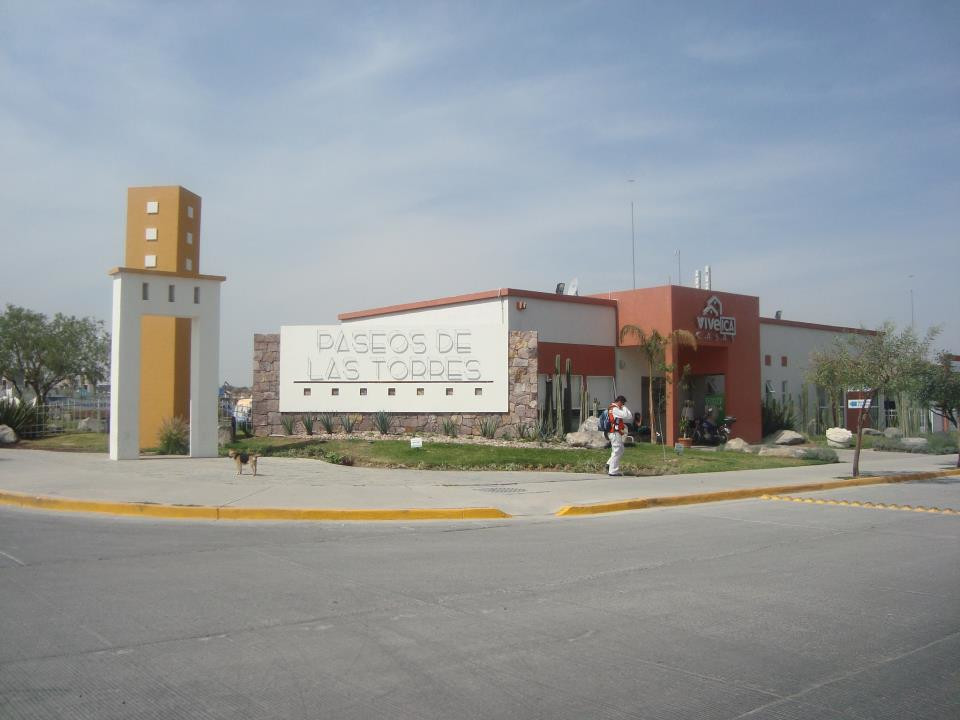
Standing in the middle of what was very recently a patch of bare dirt, a community of 29,000 people can now be seen – if you know to look for it. Unfortunately, Censo 2010 demographics won’t even show that this community exists, because development didn't start until after the demographic data were collected. On the other hand, Geoanalitica’s Mexico demographic data build process is adept at detecting and measuring growth stories like this. Let’s take a look at the history of the 7,000-household community centered around Paseos de las Torres, a sprawling residential development in northwest of León, Guanajuato.
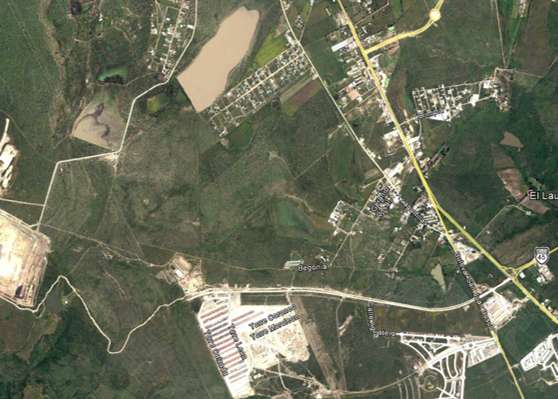
Paseo de las Torres first began taking shape in 2009. Although this was the year that INEGI delineated the AGEB boundaries that would become the focal point of Censo 2010 a year later, there are no AGEBs drawn around this under-development project. The nearest urban AGEB is over a mile away, which is not uncommon with mega-developments that require lots of easily titled and inexpensive land.
Paseo de las Torres probably began to see its first residents move in sometime during 2010 or 2011, too late to fill out their Censo 2010 questionnaire – not that it would have mattered much, without an AGEB for INEGI to summarize their data into. And, within a short span of time, neighboring communities began taking form. First, there was UrbiVilla del Roble (circa 2012), followed by Brisas del Campestre (circa 2013), and Katania, Danubio Azul, and La Querencia (2014-2015). There’s still construction going on currently, with Residencial Cordillera expanding even during 2017.
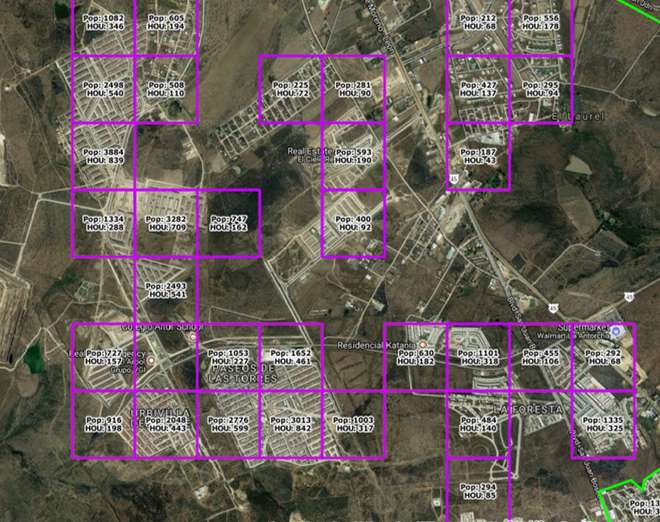
Apart from growth, GeoAnalitica also estimates the socioeconomic class that best describes each Growth Grid. In this part of Leon, we see a mixture of lower-spectrum classes, with heavy presence of D, D+ and C- households. There’s a smattering of C and C+ households (some of the most recent developments could be described as “affordable luxury”). In all, we see household annual incomes ranging from MXN$160k to MXN$260k in this area, which reassures us that there is indeed a consumer presence in this community.
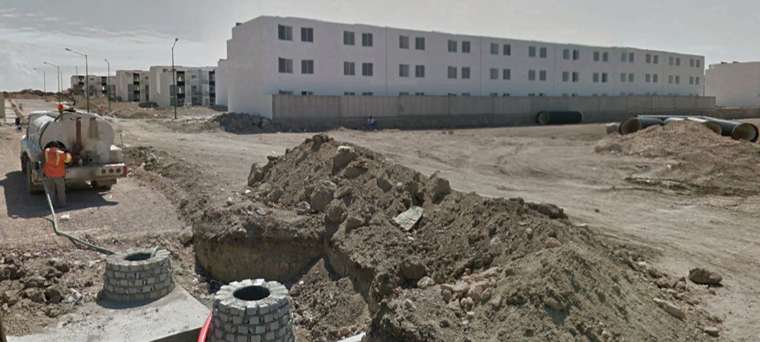
The scale of growth is staggering. The past seven years of development in this corner of León could be enough to sustain a large, localized retail presence. Yet, our analysis of retail in this area shows just a Bodega store, an Oxxo, a pharmacy and a pawn shop – and all of these are in the “oldest” part of the development. Opportunities are being missed simply because these developments are too new to appear on INEGI demographic maps.
While the Paseo de las Torres example is noteworthy, it’s certainly not unique. There are thousands of growth stories unfolding nationwide, many of them dealing with thousands of households themselves. GeoAnalitica is the only data source that is programmatically identifying and measuring these growth stories as part of our annual, updated Mexico demographics packages. Keep checking out our blog for new growth stories, or get in touch with us for customized insight that could help your organization avoid missed opportunities.