
In 2018, it seems like “more” is always better. More options. More insights. More data. But when it comes to Mexico demographic data, some users would rather have a high-level view. That’s why we occasionally get requests for Mexico demographic data at the municipio level, a notch or two less granular than our main product goes.
You may be thinking, why would anyone want to look at something less granular than, say, an AGEB or a localidad? There are a few good reasons, and they all revolve around what we call “fit for purpose”. In other words, a strategic choice to use municipio shapefiles and demographics to solve a particular analytical need or fit into an existing business process. There are also some not-so-good reasons that have become so ingrained in organizations’ GIS analytics that there’s a lot of anxiety about using any other geographic unit. Let’s talk about some of the most common reasons – both the good ones and the bad ones -- to rely on the municipio as the geostatistical unit of choice.
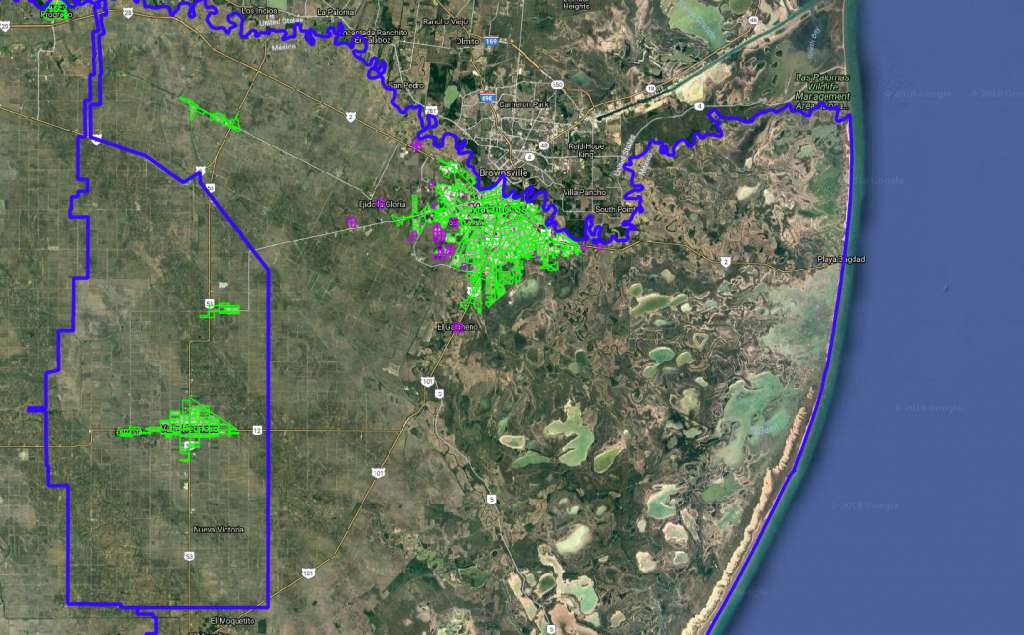
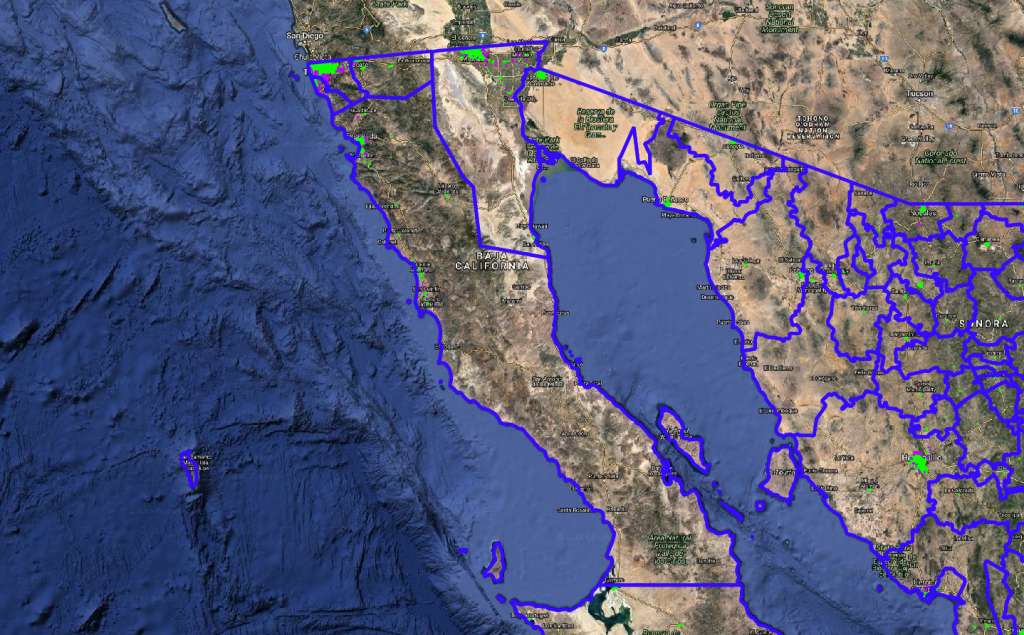
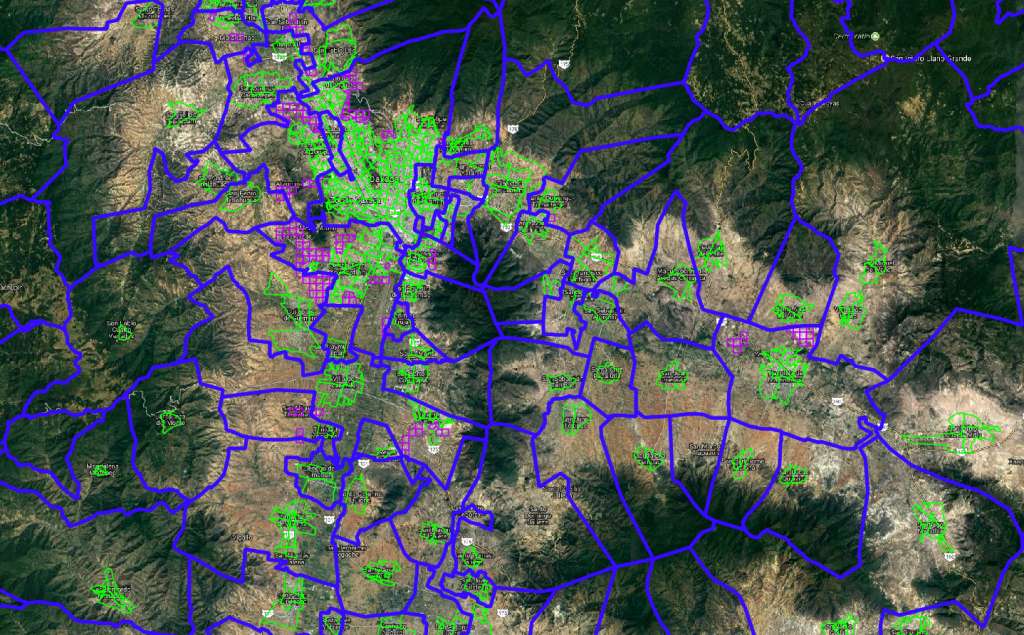
There are some perfectly valid reasons to use municipio demographics for Mexico as the sole data source for business decisions. One of them is mapping – serious, old-school cartographic layouts designed to make a visual impact to help decision-makers understand the geographic context. When it comes to mapping AGEBs, Manzanas or even our proprietary Growth Grids, good luck making a national-scale or even a state-scale thematic map to show comparative demographics. The reason is simple: these urban geographic units are really small, very numerous (56,000 AGEBs nationwide), and only cover a fraction of Mexico’s territory. They were not really designed for big-picture analytics, but rather, small-area analysis, like looking at a trade area or an urbanized zone. Mexico’s 2,400 municipios make for a much more impactful thematic map to give general context to high-level decision making. (Nonetheless, there’s lots of potential for error, mainly because the geographic extent of a municipio has little relationship to the magnitude of the population residing within it.)
One other very good reason to rely on the municipio is the availability of ancillary data. Unlike an AGEB, which is a purely geostatistical unit used for census counts and analysis, a Mexican municipio is also a political unit. Municipios have their own elected governments, who provide municipal services, and in the process create a large volume of data, much of which has become easily accessible over the past few years. Need to analyze the number of vehicles on the road in an area? You can grab this data at the municipio level. Same goes for crime data. A municipio is the lingua franca of Mexico’s open data initiatives. What’s more, some organizations make their own data at the municipio level (for example, customer intercept data).
There are also a few bad reasons to use the municipio as the main geography in a business process. First of all, there’s habit. For a long stretch of time, most of the demographic data that could be downloaded, bought or licensed was at the municipio level. Traditionally, this was called Admin 2 level data (in the geostatistical hierarchy under Admin 0 and Admin 1 – respectively, the national boundary and state boundaries). If you look at the main GIS platform providers, all of them will resell a plug-and-play municipio dataset of some sort, nearly always dating back to Censo 2010. Once those 2,400 municipios become ingrained in a corporate process, it’s really hard to switch away from them.
Another poor reason to turn to municipio data for Mexico is to conserve resources. That goes in a couple of directions: municipio level data can be less expensive than AGEB data (though not always) and take up a smaller footprint as a .shp or .tab file. Both of those reasons were valid a few years ago, but times have changed. Many muncipio demographic datasets are now as expensive, or even more expensive, than similar AGEB-level data, yet they are still stuck in a time warp at Censo 2010. Meanwhile, GIS platforms and the hardware they run on have advanced to the point where dataset size no longer makes much of a difference. Local copy or in the cloud, a 70,000 feature dataset like GeoAnalitica’s loads in seconds. Program crashes like we used to experience back in the early 2000’s are now a rarity, rather than the norm. The costs and tradeoffs of micro-level geodemographic data have improved dramatically, and the real winners are everyday users.
What’s GeoAnalitica’s position? We are, first and foremost, a micro-level data provider for Mexico demographics. Our methodology specializes in urban areas, and our philosophy is centered around enabling small-area spatial analysis. That said, we believe in empowering users to chart their own course. We believe that municipio-level data for Mexico is a supplement to AGEB and Growth Grid data, rather than a substitute for them. As such, we work with our clients who require municipio data on a customized, needs-oriented basis. While that means we don’t have a municipio-level product in inventory, it also means that an engagement with GeoAnalitica helps clients meet their unique objectives with a holistic, total solution.
If you’ve stuck with this blog post this long, we’re probably speaking your language. If you’re struggling with municipio-level data, or searching for a solution that’s more tailored to your unique analytical needs, there’s a chance we can help, so reach out to start the conversation with us.