
Today, we’re excited to bring to market our newest Mexico data release. Our 2018-vintage demographic estimates carry the torch from prior years, utilizing a consistent growth-adjustment methodology fueled by the most recent data available. As always, our Mexico demographic data shed light on small-area changes in urban and semi-urban areas, whether or not there’s an urban AGEB shape outlining a given growth area.
First, let’s take an [admittedly oversimplified] look back on some of the driving themes of 2018. If we were to sum up Mexico’s 2018 in one word, it would definitely be AMLO. The dynamic between the government and the governed is changing, and the stories we’re hearing indicate that Mexico’s decision-makers and power-players spent much of 2018 unsure of the future of policy and how it might affect business investment.
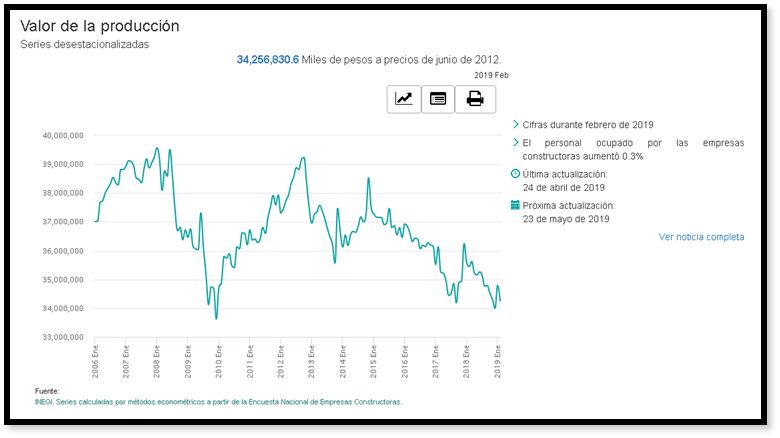
Whether causative or just simply correlated, our 2018 process identified fewer of the massive residential developments, the likes of which have characterized Mexican urban growth in prior years. This is consistent with the macro-level data we are seeing from INEGI’s observations of GDP by sector: the value of production for Construction Activity has reached about a nine-year low in constant pesos (see chart below or original).
Consequently, fewer Growth Grids (n=1572) were identified in the 2018 vintage compared to the prior year. While accounting for 170,000 housing units and 660,000 persons, the Growth Grids do not tell the entire story of growth for 2018. Continued growth in existing AGEBs, as well as in ‘legacy’ Growth Grids from prior vintages, accounts for the remaining 592,000 housing units and 2.3 million persons who have appeared in urban and proximal areas. Overall, GeoAnalitica’s data coverage has surpassed a symbolic threshold, with our total 2018 population count exceeding 100 million individuals for the first time. (As a point of reference, if users were still relying on Censo 2010 AGEB data, they would only be seeing 86 million individuals. The GeoAnalitica approach has identified the equivalent of an extra one-and-a-half Mexico Cities across the nation since 2010.)
With regards to the socioeconomic picture, changes versus the prior data vintage are not dramatic. The macro-picture described by many leading think-tanks seems to confirm what we see in the micro-picture: mainly, that new household formation among the lower socioeconomic rungs is occurring faster than upward social mobility can keep up with it. Mix in a housing financing system that is subsidized for lower income families, and it’s no surprise that new household growth is tilted toward mid- and lower-mid tier households.
To close this out, we invite you to think of this blog post not so much as the end of a story, but more like the prologue. The real story plays out in Mexico’s AGEBs (and outside of them, too), where real-life people are setting up homes and building their own communities. Whether you know who’s there or not depends on the data you’re using, and whether it was designed to seek out and quantify population growth. We can’t wait to share some of the stories we’re seeing in GeoAnalitica’s Mexico 2018 demographic data.
2018 totals for GeoAnalitica’s coverage areas:
- Occupied housing units: 26,414,917
- Total Population: 101,320,407
- Average annual household income: MXN$222k